Articles
Articles on setups and psychology and anything in between.
Table of contents
ALL YOU EVER NEED TO KNOW ABOUT STOP LOSS PLACEMENT
Are Stops Necessary?
I imagine this is going to be my least popular article ever. It deals with stop-losses!!!
If you are a typical retail home trader, you might think stop-losses are unnecessary, but no professional trader with proper supervision will be able to trade without an exit strategy of some sort. If you want to trade like a professional, you are forced to consider the possibility you are wrong about the trade. Your job depends on it.
This article is not about why you should use a stop-loss. Rather it is where you should place the stop loss.
WHAT QUESTIONS DOES ARTICLE ANSWER?
During a trip to Denmark, I gave talks about trading and investing. I came face to face with both traders and investors. I discovered that investors are lousy risk managers. They have an attitude of invincibility. They think because they invest in the long-term they don’t have to use money management.
Up in Aalborg I came face to face with a particularly ignorant investor who said he didn’t need to stop losses. He bought for the long-term. asked him about his most recent purchase. He had bought Novo Nordisk at 310. It was now at 290. I asked him if he would hold it if it fell to 270. He said he not only would hold it, but he would buy more. What if it fell to 250? He said he would consider it cheap, so he would probably buy more. What if it fell to 200? He said if it got to 200, he would get out. That would have been too much for him.
The bottom line, the man DID have a stop-loss. He just wasn’t aware of it until he came face to face with a big loss. Everyone has a stop if you go through this mental exercise before your trade or your investment. I imagine that his stop loss could have been at a better place than at losing 33% and adding to the losing trade.
This article will focus on the techniques for placing stops on your positions. Before we come to that, there are some DO’s and some DO NOT’s when it comes to stops:
Stops don’t come natural – so you have to train yourself to use them
Everyone knows that placing a stop-loss is like admitting the possibility that you could be wrong. As no one knowingly goes into a position with the thought they might be wrong, placing a stop-loss is not a natural action. However, if you learn to place your stop-losses well, you might end up enjoying the process. At least consider it as natural and as necessary as the surgeon her their hands before operating on you.
Your capital is your lifeblood – stops keep you alive
I seem to have taken a step into the medical metaphors so why not stay there for a moment. Your trading capital is your lifeblood. If you don’t protect it, you will die. All stops do is to protect you.
DO place stops when you are thinking straight
DO place stop-loss when you are thinking straight – not when you are under stress because position is losing you money. It is hard to think clearly when you are about to be hurt.
DO NOT move the stop-loss further away EVER
Stops are a one-way street. When you are long you can only raise the stop. When you are short you can only lower it. We all know how frustrating it is to have our stop-losses taken out, and then see the market move back in our favour. However, that is not an argument for not having stop-losses or for moving a stop further away – and giving the trade “a bit more room”.
So let’s focus our attention on learning how to place good stops.
Do all market professionals use stop losses? NO.
There are many segments within the trading and investment community that do not use stop-losses. Hedgers don’t use stops. They sell out future inventory. Option traders may use options as a hedge (stop loss) against a position.
The market is often like a chess game for big traders. They don’t want to tip their hands. If they put a stop-loss in the market in a big position, it is like a red cloth to a bull. The market will seek to move to where there is liquidity. If there is a big order resting somewhere, the market may see this and be drawn towards it.
Big traders may not place stops. We are talking BIG here, probably not people like you and me. These iron-willed professionals will have mental stops but probably not physical stops. They don’t want the market to know where the stops are or they don’t want their broker to know where the stops are (remember a broker makes money from executing trades, so it will be in his interest that the client is stopped out).
When their levels are touched they will take their loss without remorse or second thoughts. Taking losses is part of the process of making profits.
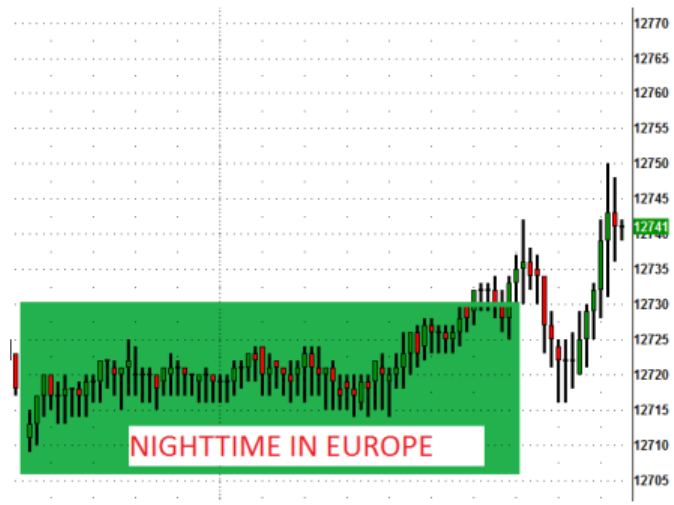
Placing a stop loss is a challenge. We want to place a stop close enough to protect your capital but not so close that it is sucked up in the „noise‟ of the market. What is “noise” I hear you ask? Noise may mean different things to different people, but to me “noise” refers to the back-and-forth movement in the market, which doesn’t change the trend.
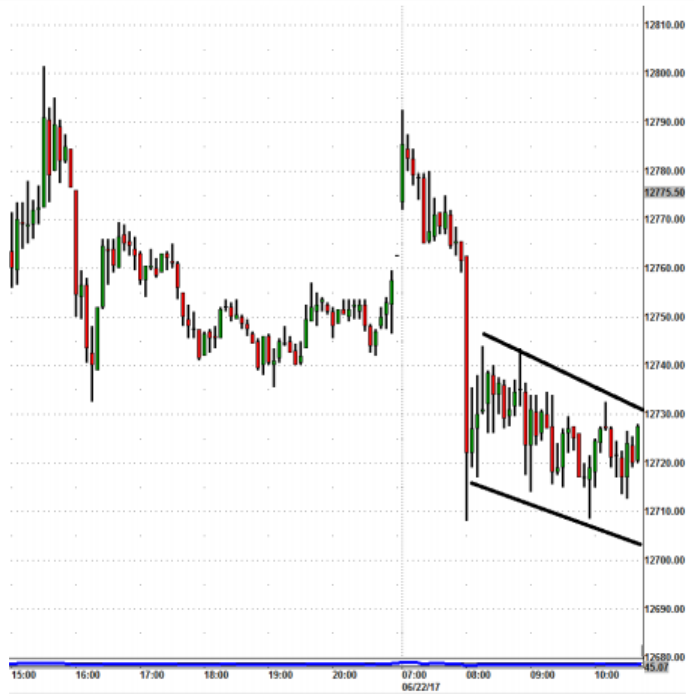
The DAX trend looks negative, but within the two black lines the market is oscillating around 30 points up and down – without changing the trend or continuing the trend. I define this as noise.
However, you can’t ignore the noise as if to say it doesn’t matter. I was short the DAX in this example, and I defined the noise as the trading range between 12740 and 12710. I placed my stop-loss outside the noise. Soon after this screenshot was taken, the market flew up to 12800.
Noise means different things to different people. Short term traders see backing and filling activity as noise. Some call it the ebb and flow of orders and business being executed – without meaning – and it does not change the direction of the market.
For long term investors, the daily volatility is just noise in a big bull run and they may not even pay close attention to it. They know not to get sucked into the emotional fray of short-term movements if they want to secure big profits. Noise could be measured in per cent in their world. It is all a matter of perspective.
Stop Loss Techniques
Let’s look at a number of techniques suited to short term trading. I am a short-term trader and so are you likely to be. Short term here means day trading and trading for a few days but really not beyond 2-3 weeks.
Hard Stop
A Hard Stop is one in which you simply place a stop a certain number of pips or points or per cent from your entry price. For example, you always use a 12-point stop loss in DAX or a 25-point stop loss in Sterling Dollar.
This stop-loss doesn’t make much sense, because it assumes the market is always in the same state of volatility. It sure as heck isn’t. I have seen the Dow Jones index trade in a 20-point range all day – the day before Xmas. I have seen the Dow Jones jump in 50 point increments – the day Lehman Brothers went bust.
Why would you place the same 12-pip stop in both a quiet market and one showing volatile market conditions? Similarly, why would you risk the same 25 pips in both quiet and volatile market conditions? The stop is not related to the market in any way.
Despite its obvious flaws, this technique is one of the most common methods used for placing a stop loss. This is also the preferred method for professionals and their risk managers. When I traded for a company, I was told I could not lose more than 50 points. As long as my losses were 50 points or less I was fine. The end result was that I always risked 50 points, even though my stop loss could have
been far less.
A trader friend recalls a story from his days trading at a prop desk. “We had a risk manager who let us get away with murder – as long as our losses were less than 35 points. It was insane because we could lose 35 points and then put on the same trade again – again with a 35-point stop loss. Even when we needed a much smaller stop-loss, we would still use a 35-point stop, because it gave our position much more leeway. The problem was that whenever we lost, we always lost 35 points.”
I don’t think hard stops should be used. They are plain dumb to use.
Volatility Stop I
Volatility is two-edged for traders, but I remind myself that as traders we live by the sword and we die by the sword. I love volatility and at the same time, I hate volatility.
For example, how often have I bought into a signal during the morning hours in the DAX, and built up an acceptable position, and then seen my stops hit because the US markets open, and volatility cranked up 100% for 30 minutes or so?
As a short-term trader, I like the mix of quiet and volatile markets. Volatility is often associated with losses and is often blamed for them. For a day trader, this is not true. Yes, higher volatility does mean higher risk as a direct result of higher fluctuations in the price. However, while it is a concern for some, we do need volatility to make money as short-term traders. Really, volatility is a degree of uncertainty. Without volatility, there is no opportunity for short term profit.
The Volatility Stop technique adapts to the market. It is dynamically self-adjusts. As such it is a much smarter way of placing a stop-loss than the “hard stop”.
What tools can you use under the heading of “Volatility Stops”.
There are a number of ways to measure volatility but a simple technique uses the Average True Range (ATR). This was developed by Welles Wilder. All charting packages will have this function.
Volatility Stop Method 1
ATR is a measure of the underlying volatility of an instrument. If the Daily ATR is 100 over a 14- period setting, then it tells me the average High Minus Low is 100 points. Can I use this for anything as a day trader, who trades a 5-min chart? I believe I can.
On the FTSE chart, I have established that the daily ATR is about 55 points. The average of the high minus low is 55 points over the last 14 trading days.
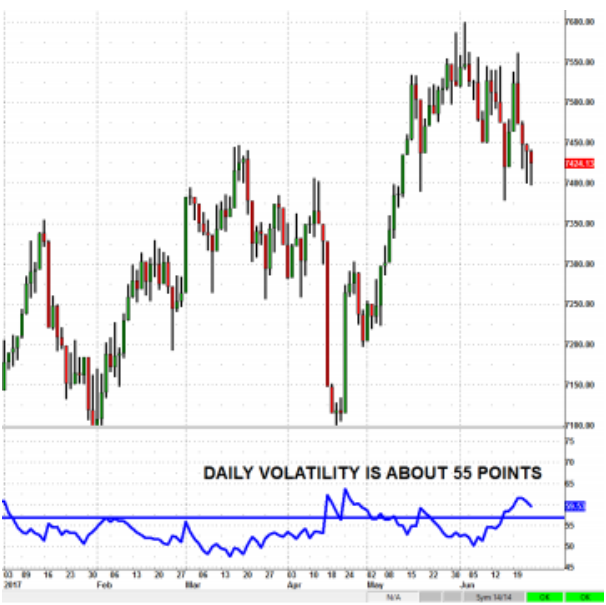
The 55 points represents a daily volatility average.
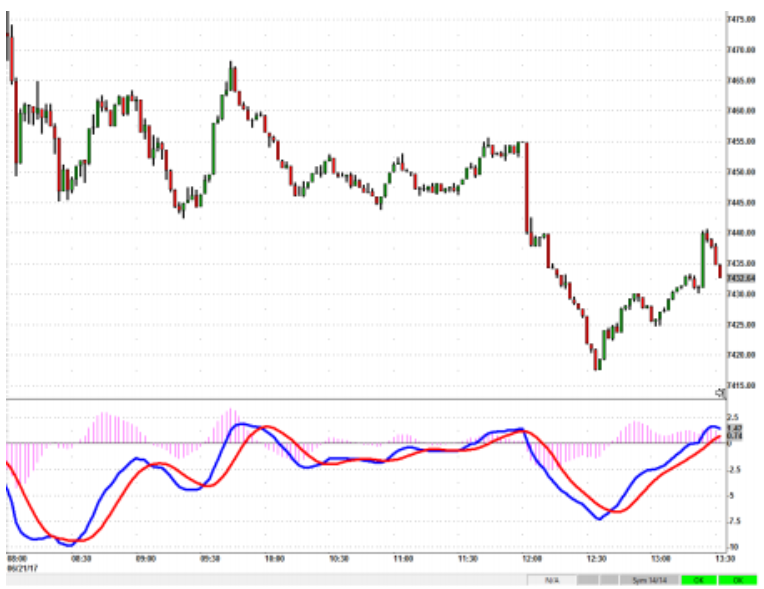
I will introduce a simple trading technique in the FTSE index by way of example. The MACD is a simple tool for timing your trading entry. I am not going to tell you what techniques to use or not to use. I find MACD a little slow. Remember – it is an M Average CD, so there will be a delay in the signal, but for the sake of the example, I think you will like its efficiency.
The idea of a MACD system is to buy or sell short based on the crossover of the lines. The ATR suggest the stop-loss and the target.
I will use 20% ATR stop – meaning my stop loss is 20% of 55 points. If I risk 11 points, I will want to use a 150% target, meaning I will want to make 16.5 points. If I get a MACD counter signal and I am still long/short with a profit, I will move stop loss to breakeven, or I will take a loss.
I use a standard generic MACD with a 12-26-9 setting.
23rd June 2017
Entry Time Price Profit/Loss?
08:32 7413 0
09:42 7413 minus 7
09:52 7419 plus 4
10:42 7423 plus 16.5
11:34 7402 plus 16.5
13:34 7424 minus 7
13:56 7430 minus 4
14:02 7426 plus 16.5
14:54 7415 plus 16.5
15:54 7435 plus 4 (note – closed the position as market closed)
I am writing this on the 24th of June in the morning. So I am going to record the results for today in real-time:
Entry Time Price Profit/Loss
08:22 7464 minus 4
08:52 7466 minus 11
09:18 7467 minus 4
09:36 7465 minus 1
09:50 7466 Plus 16.5
FTSE then went into a 5 point trading range for the next 110 2-min bars. This is where an element of skill and knowledge will save you from being whipsawed from short to long and back.
15:36 7468 plus 16.5
16:14 7448 plus 5
The problem with MACD is that it is a lagging indicator. Another problem is that you don’t know for sure that a MACD cross has taken place until the bar has ended. More experienced traders could probably get better entries than I have (although I doubt it – these things tend to even themselves out over time). Here I have waited for the actual bar to close to confirm the MACD signal.
The stop-loss ratio and the profit worked exceedingly well – although it was a very limited sample space – to the point of being meaningless. Nevertheless, I hope this gives you appetite for doing your own research – or continue where I have left off.
The 55-point average daily range has 2 possible functions for me.
- Am I trying to stay out of the noise whilst scalping and intra-day trading? 2. Am I trying to stay out of small counter-trend swings?
If I am trying to stay out of the noise for the sake of trading the market short-term (on say a 1-min or 5-min chart), I will use a stop loss of 20% of the daily ATR. At the moment, this means running stops in the DAX intra-day at around 24 points, while the FTSE I run stops around 11 points.
You must appreciate that we are talking short-term trading – with intense screen watching. I am not sure most people can stomach a 24-point stop loss in the DAX, unless they frequently get 36 points or more in profit.
I used to be ok with trading the DAX with a 12-point stop loss. That was when the DAX was trading at 8000. Now it is trading at 12700. The ATR forces you to adjust your stopover time as your products increase in absolute price.
If my desire is to run a swing trade lasting more than one trading session, then I need to entertain the idea of having a stop loss of more than 50% of the daily ATR. This means using a stop loss of 28 points in the FTSE at this point in time.
I admit that there is an arbitrary element at play here. Why 20%? Why 50%? The fact of the matter is that I need to weigh the desire for good money management with the time expended doing the research. I make my money by having positions on. The research is my road map for my action in the market, but I can’t be all “research” and no trade. These two percentages have worked well for me.
I write this, not to make excuses or deflate myself, but to make sure you know you are free to inject your own taste and style into my suggestions (I am stating the obvious – I know you will anyway).
Currently, Sterling Dollar is trading at 1.2700. The Daily ATR is 90. A variation of the volatility stop is to use 10% on markets where the spread is lower and the volatility is lower. 10% stop is 9 points loss with a 13.5 profit.
26th June 2017
Entry Time Price Profit/Loss?
07:10 1.2745 plus 13.5
09:00 1.2744 plus 13.5
11:20 1.2734 minus 9
15:20 1.2728 minus 9
26th June 2017 (again – but with a 20% volatility stop – risk18 to make 27)
Entry Time Price Profit/Loss?
07:10 1.2745 0 (moved stop loss up when position more than 10 in plus) 09:00 1.2744 plus 27
11:20 1.2734 0 (moved stop loss up when position more than 10 in plus) 15:20 1.2728 plus 10 (close position at market when trading day over)
The market has a “human volume” rhythm which means you need to appreciate that volatility is not uniform throughout the 24-hour time period. For example, FX traders in London are ready to work around 7 am. Until then the market is dead. The green shaded area should give you all the evidence you need to understand that nothing is going on.
Some mornings the market is screaming its head off. Other mornings the market is merely limply whispering its message. I will adjust my stop accordingly.
Volatility Stop Method II
I am currently short Dollar Yen. I am doing my best to stay with the position – balancing the trade-off between giving the position “space” but not too much space.
A simple method centres around the size of the counter-trend moves. Dollar Yen is trending down, but there are counter moves where traders are taking profits or commercials find the current price attractive.
I am trying not to get stopped out in the counter moves because I am hoping they are short-term temporary moves against the dominating trend.
The art of drawing a line on your chart of the size of the corrections gives you an idea of how much past corrections have amounted to. In a strong or a medium strong trend, corrections tend to be similar.
Today I am attempting to roll my stop so it is constantly about 15 points away from the current market price (but never moving the stop higher – of course. The last corrections have been about 9- 12 points in size. As I type this my stop will be hit in a few ticks. Maybe.
This is a dynamic stop – a clever stop loss technique and a very potent tool for short term traders because it adjusts to the market rhythm. More technically speaking traders well traversed in the art of geometry trading would say that any correction above 12 points will “over-balance” the structure of the chart, and the market is telling you that it is now in a different degree of wave. It sounds quite Elliotastic.
2-Bar stop loss
The 2-bar stop loss is simple to explain. Imagine you are long the market. You look at the current bar and you compare it to the 2 bars that came before. Your stop loss should be just above the high of the two previous bars.
If the current bar closes, and you can see that the new 2-bar high is actually the bar that came just before the one which just closed, then you can move the stop loss down just above the high of the previous bar.
There are many trading techniques which are good at generating very timely signals. The Stochastic generate frequent trades. The good ones move fast in your favour but they tend to not last long.
We need to work a tight form of exit control, otherwise we will not be profitable. We must accept that Oscillators are often wrong. We have to budget for that and keep losses small because they will be frequent.
Here we have a 5-minute chart of Crude oil. I have used a Stochastic method. I review the stop-loss after each 5-min bar. I will keep trailing the stop-loss up (for the long position) and review every 5- min. If the next bar is an inside bar, where the low is higher than the previous bar, and the high is lower than the previous bar, then I do nothing.
Here I am trading US Light Crude. The signals are below
Time Price Signal Risk Exit Time Exit Price
13:20 43.16 Long exit below 43.06 13:55 43.26
13:55 43.26 Short exit above 43.34 14:45 43.14
What is interesting for me to demonstrate is how the Stochastics (long) gave a slightly better exit than the 2-Bar stop loss.
Marubozu Stop
A Marubozu bar is the technical term for what I call an Extended Bar or a Road Map Bar or even an Aggressive Bar.
It is basically a bar which tends to be longer than the preceding bars, but its most important feature is that it has no head or tail (or sometimes neither). Some call them Hit And Run bars.
It is a powerful candlestick pattern.
If it happens against the trend, it is a reversal pattern like a „key reversal‟. In the direction of the trend it marks extreme conviction. So if you are long and get a Marubozu, the conviction is strong that it will continue. The market has put on a spring.
Often this leaves even our aggressive stops uselessly far behind. We cannot allow a reversal of that side before cutting the position. That would leave a lot of open profit unsecured.
The trick is to use the mid-point of the Marubozu as the stop loss (or slightly above the mid-point). Normally if the confidence is high the half way point is enough cover for you.
Indicator Stops
The idea is to make the market show you a sign of weakness (or strength, if short) before you get out. You are less likely to get shaken out of a trade. This method makes more sense than trying to pick a top to exit your long or a bottom to exit your short. We need very sensitive indicators for this. Anything slow (moving average based) will be too late giving us the message. The best indicators to use for a stop trigger are indexed indicators such as RSI, Williams%R, Stochastics or the Commodity Channel Index.
We saw an example of the Stochastic giving a Sell signal when I was short crude oil in the example above. I got the exit signal before the 2-bar stop was activated.
Best Loser Wins
BEST LOSER WINS
A professional day-trader reveals the real secret to financial success
by Tom Hougaard
www.tradertom.com
FREEDOM ROAD
What you become in life is dependent on the decisions you make and how you react to decisions made on your behalf.
At Stanford University, Steve Jobs, standing at the podium in front of the class of 2005, gave the new graduates their commencement speech — advice on how to live life.
It went something like this:
“Remembering that you’re going to die is the best way I know to avoid the trap of thinking you have something to lose. You are already naked. There is no reason not to follow your heart.”
Few can walk the walk when money is on the line. The main contributor to not having the life you want is fear. Most play this game, called life, safely within the boundaries they set while growing up, boundaries built by avoiding pain and anxiety.
They come up with excuses for why they made one choice over another — the voice inside keeping them on the safe side of the fence.
The average seeks average lives, but the world is not built by average people — it is built by the unreasonable who dare to elevate themselves, who reject the average and go all-in for success. I am often asked how I made it to the top of the trading pyramid, so I decided to put it down on paper. I am not here because of IQ; I tell you that immediately.
I am here because of my relationship with pain.
Our brains so hate the idea of losing something that is valuable to us that we abandon all rational thought and make some really poor decisions.
The success you desire is closer than you think on the other side of this door, but if I hand you the key, will you open the lock?
It’s your choice. Nobody can do it for you. Unlocking the door is only the beginning. You have to walk through it.
It requires attention, focus, dedication, and sacrifice. It takes courage.
I am giving you the key, and the only question now is will you use it?
My name is Tom Hougaard.
I’m a financial trader — an inspiration to many, and, no doubt, the envy of some.
I don’t work for anyone, I work when I want to, I own more than one expensive car, I live in a big house, and I have no debt.
For many, that is living the dream. The definition of success is subjective, yet for me, personally, it is not about the money.
It’s about one word.
Freedom. The freedom to spend time with my family and live life on my terms.
Many desire the lifestyle I lead, seeing only the outward symbols of success, but few are prepared to acknowledge the dualistic and interconnected opposites that are required to build it.
The markets never sleep, so my sleep suffers regularly. I don’t work for anyone, and I rely 100% on what I make from trading. If I don’t feel well and I’m forced to stay in bed, there is no sick pay.
Every day, I have the opportunity to make or lose a fortune, but to do so means I have to live with and accept risk — risk like an unexpected news event that will violently move the market against my position.
I am constantly battling the odds.
95% who attempt to do what I do fail. Probably even more.
THE INCONVENIENT TRUTH
In financial markets, the traders that win, the 5%, make all their money from the 95% that lose.
Every year, I’m contacted by thousands and thousands of people who want to know my secret.
Why?
Because I make money trading.
Do you know why I win consistently over time?
Is it because I’m an expert at technical analysis? No.
Is it because I’ve purchased an expensive, exclusive piece of software that gives me great trading signals?
No.
Is it because I have friends in high places who feed me insider information?
No.
Is it because I have discovered a secret charting method? No.
Do you want to know why I am so good at trading, and why I make the big bucks?
Lean in now, because, right here, you’re going to learn the number one secret of success in trading.
Ready?
I am exceptionally good at losing.
When speculating in financial markets — The Best Loser Wins.
Don’t underestimate these four words.
Going against the conditioning that life, in our modern world, has programmed you with, success in financial market speculation is not about being the best, coming first, and winning.
Instead, it’s about losing.
And that’s why I win.
I win because I’m really good at losing.
In trading, unlike life, it’s the best loser that wins.
MANY ARE CALLED FEW ARE CHOSEN
Trading attracts many people who shouldn’t be there.
They are led to believe that trading is easy. Maybe the broker is tempting them; I’m sure you’ve seen the broker advertisements where a calm, confident actor, knowingly pressing buttons in front of a bedazzling array of screens, walks away victorious with a confident smirk.
If you look at the trading industry, we are led to believe it’s built on trader tools, hundreds of built-in indicators, and more recently even programming languages to enable you to code your own.
And, with the ability to back test, traders can look back and see how much they’d make or lose, giving them the confidence to take action.
It’s an illusion.
How do I know?
Because, for years, I was an insider working at one of the largest financial market brokers in the City of London.
During my 10 years in London, the stock market rallied, nose-dived, rallied again and then crashed.
Gold went from $250 to almost $2000 an ounce, a spectacular bull market.
After the fact it looked like child’s play to make money. But here’s the thing…
Almost everyone lost.
Out of the thousands and thousands of people who opened an account, only around four percent managed to keep their money, let alone make enough to replace their day job.
Did you know that Harvard University received a total of 43,500 applications for their courses in 2020?
Out of all of those applications, Harvard will only accept 1,950 students. The success rate is just 4.5%.
The success rate in trading is about the same.
The success ratio isn’t broker specific. It’s systemic, happening everywhere inside all brokerages — not because the broker is cheating in any way, in fact, the broking industry is highly regulated, and it’s not because they take the other side of your trade and run your stops, the exit position you advertise to them when you take a position.
So, if the reason is not the broker, then what is the problem?
Why do so many people lose?
Statistically speaking, it should be impossible for so many people to lose. If the market is random, and market movement is, most of the time, random, why do 95% of clients consistently lose a 50:50 bet?
The answer is as simple as it is complex.
It isn’t the market-beating them.
They are beating themselves.
I wasn’t always a successful trader. To become successful, I had to break down the barrier that separates the many from the few, in a business where there is no instruction manual, and where the lesson comes after the test.
In 1997, with a master’s degree in Economics, I got my start at Chase Manhattan Bank as an analyst. In my late twenties, and driven to succeed, after three years at Chase, I handed in my notice, having saved enough to start the business of my dreams.
Excited and full of hope, I began my new career as a day trader. It took thirteen months to lose it all. Reality’s bite is worse than its bark.
Needing a job, I began work at a CFD broker based in London.
My official title was market analyst, but a large part of my responsibilities was to be the educational bridge between the company and its customers. While working with trading clients, it didn’t take long for their behavioral patterns to get my attention.
I was headhunted to another brokerage in 2002, where, for the next seven years, I continued my role working with trading clients.
Almost immediately, even though I was working for another broker with an entirely different group of traders, I noticed the same patterns of behaviour.
My observations converged into insight.
As a group, traders are predictable.
Or, more accurately, their outcome is predictable, because everyone is doing the same thing.
Over a decade working as an insider in London brokerage houses, working with the public, watching markets from 7am – 9pm, I witnessed first-hand the misfortunes of others.
I saw what trading with the wrong mindset could do — the damage some clients had inflicted on themselves, the unleashing of raw emotions from people completely unable to accept responsibility for the consequences of their actions.
It was upsetting and very unpleasant, and there was nothing I could do. Clients would beg us to reverse their positions, breaking down and in tears, or shouting and abusing us, unable to come to terms with the amount they had racked up in losses.
It was as if the light had gone out of their eyes.
I saw thousands of clients, many of them highly intelligent people, who, outside of trading and speculation held down positions of great responsibility, yet, engulfed by the market, they were completely unable to manage themselves while their trades were losing money.
After observing over 100,000 people, and close to 100 million trades, over a decade on the trading floor, predictable patterns of human behaviour came into the light.
Watching thousands of traders execute millions of trades, their behaviour, almost as if they were connected together in one hive mind was predictable in that, week after week, and month after month, year in, year out, when they were making a loss, they hoped the market would give them back their losses, yet, when they were making a profit, they feared the market would take it away.
They were fearful when they should have been hopeful.
They were hopeful, when, in fact, they should have been fearful.
These human experiences helped make me the trader I am today.
Watching them struggle, I realised they were searching in the wrong place.
The answer they were so desperate to find is not found in the external.
It’s not found in the software, or in any of the tools; instead, I realised, the answer, if not found in the objective, must be internal inside the self.
GLADIATOR
In the silence of the early morning, I’m in my office, preparing for the day’s trading. Minimal and uncluttered, with four screens, you won’t find water-cooled computers with flashing lights, no systems with monitors arranged like a drum-kit running news feeds and indicators.
Instead, apart from my screens, the keyboard and a mouse, there is a PowerPoint presentation on a screen. It is the key to my success. I should say it is MY key to success.
The PowerPoint file is my cue. At game time, before I begin to trade, it’s time to become someone else.
In the movie Gladiator, why does Maximus Decimus Meridius engage in the ritual of rubbing dirt in his hands before combat?
It’s a ritual.
He must immunise himself before battle, to feel nothing, to become an instrument of death, indestructible, so that he can survive another day.
Rubbing dirt on his hands is his ritual of leaving his old self behind.
Every day from 5am until 9pm, even late into the night, I am battling myself.
Trading is a battle of the self.
The PowerPoint file contains old trades, mistakes, triumphs, inspirations, and warnings visually arranged to prepare me for the day ahead.
I need to become something else; otherwise, I will not make money.
This is why trading, when looked at from the outside looks simple, but, it’s not easy because trading successfully goes counter to virtually every piece of DNA stored in your body.
THE REPTILE MIND — WHO’S REALLY IN CHARGE?
In the 1960s, neuroscientist, Paul Maclean, proposed the human brain has evolved with three areas of function: The reptile brain, the limbic brain, and the neocortex.
The neocortex is the area that deals with logic, the part of your mind you can hear, the part you think is in charge.
It’s not.
So, who’s really in charge?
It’s not the limbic brain. The limbic mind deals with belonging and status.
If you’re driving a car with a BMW or Mercedes badge, it signals to everyone you have a higher status in life.
It’s tribal.
Brokers target the limbic brain in their advertising, flashing images of success, using perfectly dressed, good-looking models, to entice you to join their tribe, implying that by doing so you’ll belong to a high-status group.
It’s your reptile brain, your base-self that’s really in charge.
When you are startled, and you react, perhaps you detect a wobble in your stomach, a vibration in the lower back — that’s your reptile mind preparing you for survival, triggering a fight or flight response.
Will you run, or will you fight?
Your subconscious reptile mind has only one function, and that is to protect you.
It does this whether you want it to or not.
And this is a problem because to be successful as a trader, you need to be very good at losing, and this means constant conflict with your built-in subconscious protection system.
A system that protected you from death as a caveman guarantees you’ll not survive as a trader — unless you can learn to overcome it.
And overcoming it begins with accepting pain.
RUN TOWARDS THE DANGER
The perfect speculator is made, not born.
Neurobiology has shown we experience a financial loss 250% more intensely than a financial gain.
Lean in, because here’s the kicker — the loss does not have to be real.
It can be in your mind, yet just as powerful.
And this causes behaviour patterns to show up, and be exploited, in any liquid market.
Just before you pull the trigger, have you ever asked yourself if anyone else feels this way? When you can’t take it anymore, do you ever wonder if there’s anyone else on the same emotional rollercoaster as you?
The intensity spike of a loss, real or otherwise, is an emotional cocktail that causes an otherwise intelligent person to act impulsively.
People will do anything to end the pain. Like a crack addict looking for an axe, their brain short circuits and they react.
Pain is inevitable to some degree in life. Someone lets you down, you feel pain. Someone hurt you emotionally or physically, you feel pain.
In life, outside of trading, one way to deal with the pain is to talk to someone, as the saying goes — a problem shared is a problem halved.
Why a painful experience feels less potent after we have shared it with a friend I don’t know. Maybe the act of verbalising the disappointment puts the problem into a healthier perspective.
Either way, you feel better, and the pain subsides.
But, when I’m trading, while the majority look to run away and rid themselves of pain, I do the opposite. I run towards it. I embrace it.
Whether you are new to trading and speculation, or you have years of experience, you should give this question some serious thought:
If you want to be a success in a field where 95% or more fail, how do you think you should approach this task?
Trading looks easy on the outside, but, in reality, it’s much more challenging than people expect because we are hard-wired to do the opposite of what we should be doing, and this is why ninety-five out of every one hundred people end up losing.
The road to consistency, success, and enlightenment in trading begins in the last place you’d ever think to look.
Inside yourself.
THE KEY
So, here it is. What follows is the key to unlock the door to your success, the key to breaking down the barrier between the life you want and the life you are leading now.
If you want to succeed in an endeavour where 95% are failing, you have two choices.
You can study the large 95% losing group and do the opposite of what they do, or you can replicate what the 5% do.
If you are not as successful as you want to be, at some point, sooner or later, you need to change your behaviour.
It doesn’t matter if you’ve been trading unsuccessfully for three months or thirty years, you are much closer to success than you realise.
The 95% fail because they interpret the pain messages received automatically from our hard-wired reptile brain without any modification.
You need to learn to recode your brain’s messages when pain comes knocking.
Instead of reacting and running away, a small group of consistent traders, the 5%, hold fast and run towards the danger — not away from it.
The 5% succeed because they have learned to flip the switch.
Flip the switch!
This will feel very uncomfortable, but it is a discomfort you must accept and embrace if you want to succeed in the game of financial speculation.
It is the reason why trading looks simple but is not easy.
The paradox of trading is this: By doing what the 95% cannot do, you will become successful.
RECODE
Now you know what you must do, how do you go about doing it? Let me get specific!
A master trader from the Chicago Mercantile Exchange trading pits gave a talk to his trading colleagues.
Everyone knew he was the best trader, and packed into a tiny auditorium they hung on every word, hoping they could extract the key to success.
They didn’t leave disappointed.
He gave them three commands that dictated his trading life —
Commands that I use as the backbone of my trading philosophy — commands that you should use too.
1: I assume I am wrong – until proven otherwise. 2: I expect to be uncomfortable.
3: I add when you subtract, and I subtract when you add.
The commands are the difference between winning and losing, between consistency and success, between the large group that fail and the 5% that don’t.
Here’s how the 95% losing group behave when they trade, compared and contrasted against the mindset and the actions of the 5%.
COMMAND 1: ASSUME YOU ARE WRONG
Remember, I’ve watched thousands of traders execute millions of trades, and I noticed when most traders enter into a position, they assume they are right.
In a business where 95% of people fail, your recoding process begins by flipping the switch.
Flip the switch!
It starts with this: Assume you are wrong.
You should assume you are wrong – until proven right.
Through years of observation, here’s how the typical member of the 95% group trades.
TRADE ENTRY: 95% BEHAVIOUR
The 95% enter a trade.
The trade moves in their favour, and they’re happy. But their happiness doesn’t last long.
Almost immediately, after their position goes into profit, they wonder how far the market will move, and they begin to worry where the move will stop, causing them to feel pain.
Wanting the pain to stop, they close the position, and, removing their pain, they’re happy again.
But, by exiting the trade based on the need to end their pain, 95% behaviour now bifurcates into two equally destructive pathways depending on what the market they’ve just exited does next.
PATHWAY ONE
The market continues moving in the same direction in what would have been in their favour, and they begin to feel anxiety because they’re no longer in the market.
With their pain increasing, they regret closing the trade, and they contemplate going back in. They are no longer trading the market.
They are trading with their emotions.
PATHWAY TWO
The market reverses, and they feel elation having got out in time. They saved their open profits by closing the trade, telling themselves how good they are at timing the market.
They acknowledge their pain command centre. It was right, but they are now ruled by their pain threshold.
Now it’s only a question of time before their emotionally driven pain threshold centre sends them a false signal, causing them to lose.
Welcome to the 95% group — a rollercoaster ride of disappointment, losing money, and pain.
Instead of assuming they are right, here’s the mindset of the 5% when they enter a trade.
TRADE ENTRY: 5% BEHAVIOUR
They enter a trade, and the trade moves in their favour.
They’re not trading their account size or the available profit — they are trading the market because they understand the size of their profit is irrelevant to the market.
Knowing their profit and loss has no influence on the market, and recognising the fear in their mind as the move continues, they too worry the move will stop, and just like the 95%, they feel their brain’s automatic pain receptor kick in causing an in-built safety reflex to register pain.
The 5% are subject to the same built-in automatic pain receptor as everyone else, but the difference lies in how they handle the pain.
Instead of giving in to it, instead of being ruled by their emotional responses, they have flipped the switch, they have trained themselves to expect the pain.
Flip the switch!
They’re aware of the pain. They don’t ignore it, they accept it.
They remind themselves that their actions, if based on the need to end the pain, will dictate which group they will end up in, either the 95% or the 5%.
Maybe the market continues higher. Perhaps it doesn’t. It doesn’t matter because the 5% are not shaped by the outcome, they are shaped by their continuous process.
They understand if they focus on the process, the outcome will take care of itself.
The big difference between the few and the many is how they deal with emotional pain.
COMMAND 2: EXPECT TO BE UNCOMFORTABLE
First, here’s how the majority of traders deal with being fearful in a trade.
HOW THE 95% NEGOTIATE WITH PAIN
Some day traders and swing traders attempt to negotiate with their mind’s inability to handle discomfort and pain by using logic to trade.
It’s a flawed process. Yes, of course, it makes sense to risk ten to make twenty, but the 95% never let the market get to twenty, having closed the profitable position long before it gets there.
Others take half profits along the way, compromising, giving in to the pain, they close half their position, telling themselves it’s part of the plan.
They’re still in the market but have a smaller position; their pain subsides, and they feel better.
As the market moves further in their favour, the pain builds up again, and, with the voice in their head telling them the move is surely over, they exit the trade, closing the other half of the position.
Justifying their actions, they repeat the mantra, ‘you can’t go broke taking a profit’ to ward off the encroachment of pain as the market continues moving further and further in their favour — without them.
Their pain becoming ever more intense as they count the potential paper profits they would have made — if only they had stayed in — but they didn’t.
Remember the pain receptor kicks in whether the loss is real or virtual.
They didn’t exit the position because of a signal from the market. They exited because of a signal from their emotional brain.
They traded on emotion, assuring their permanent membership of the 95% club.
In contrast, this is how the 5% deal with their trading emotions.
HOW THE 5% NEGOTIATE WITH PAIN
The market moves in their favour, and just like the 95%, they feel pain.
The difference is the 5% expect the pain and embrace it.
What if the market takes some of the profits away?
They understand the feeling of pain is a built-in instinct, part of the mind that’s there to ensure their survival.
Again, the 5% flip the switch. They don’t trade their pain; they use the pain as a guide.
As the market moves in their favour, the 5% aren’t impervious to their in-built emotional safety switch, but they don’t snatch their profit by exiting all, or a percentage of their position like the 95% do.
Instead, they add to their position.
If the market is going up and they’re long, they buy more. If the market is going down and they’re short, they sell short more.
As the market is proving them right, they focus on the process.
The pain builds up as the market moves further and further in their favour, their protective mind telling them to take profits, but, aware of the pain and the consequences of making decisions based on it, they flip the switch.
Instead of exiting all or part of the position, they add more.
While the 95% justify their actions, telling themselves they’d go broke by not taking a profit, the 5%, flip the switch.
Repeat after me: You can go broke taking a profit.
As you’ve just seen, the 5% add to their positions when the market moves in their favour, juxtaposed to the 95% who react to their emotional safety switch and exit or reduce their position size when they are showing a profit.
What happens when a trade doesn’t go your way — what happens when you’re losing?
Let’s talk about command number three.
COMMAND 3: I ADD WHEN YOU SUBTRACT AND SUBTRACT WHEN YOU ADD
First, here’s how the 95% react when they’re losing. And, remember, I’m not repeating factoids from a book, what I’m showing you comes from years of empirical observations from my time working in the brokerage business.
HOW THE 95% REACT TO A LOSING TRADE
They buy. The market falls, and their mind tells them to buy again.
Outside of trading, in ordinary everyday life, your mind looks for bargains. Marketers know it, enticing you with special offers. You love saving 25%. It might work in the supermarket. Thinking this way, the 95% decide to buy more. But, the “supermarket effect” does not work in the trading business.
The market falls again, locking the 95% into a single emotionally driven thought: Where is the low?
Flip the switch! It can go lower.
With their thoughts controlled by the fear of the pain caused by taking a loss, all they can think about is how they’ll feel if they get out now just when the market is about to make a low and turn higher.
Adding when the market goes against them, they are locked into inaction, their brains short-circuiting, as they are unable to flip the switch to counter their in-built safety mechanism.
Focusing on the low, their capital at risk, and the need to be right, is why they lose — sometimes everything — I’ve seen it happen.
Instead of this inner conflict, how do the 5% deal with losing?
HOW THE 5% REACT TO A LOSING TRADE
They buy. The market falls. Their mind tells them to buy again — but they don’t.
Aware of the supermarket effect, aware of the pain receptors, aware of their endocrine system pumping adrenaline and cortisol preparing them to fight and combat stress, they expect this reaction and have learned to live with it.
The 5% understand the financial markets are not like a supermarket and have no memory of past prices; instead, the 5% know supply and demand dictate the price.
Just because something has fallen in price does not make it cheap.
The 5% start by assuming they are wrong when they enter a trade.
And, if the position is losing, it has proven their initial assumption right.
With conflict neutralised, they take the loss.
This is the key to successful market speculation — it’s what the 5% know.
HOPE IS NOT A STRATEGY
At any given point in time, you have three options as a trader.
You can buy.
You can sell.
You can do nothing.
For nearly a decade, I observed tens of thousands of people execute millions of trades. Their behaviour falling into three broad categories:
1: The market was falling significantly, so it appeared cheap. The clients were buying. They LOVED trying to find the low of a move.
2: The market was rising significantly, so it appeared expensive. The clients were selling short. They couldn’t conceive the idea they should be buying.
3: The clients were entering into an existing trend, but their entry was a reaction to watching prices move without them. Entering at any price was the only way they could end their pain.
Trading like this kill client accounts.
If you’ve been around long enough, you’ll know the market has many aphorisms that have become axioms.
Probably the two most common are ‘trade with the trend’, and ‘keep your losses small and let your profits run’.
If this advice is easy to follow, how can you explain why 95% of traders end up losing money.
When the loss is small, there is no urgency. There is just complacency.
As the losses rise, the sense of urgency rises with it, but still, 95% of traders don’t act; instead, another emotion kicks in.
Hope.
But, hope is not a strategy.
When losing, initially, the 95% hope the loss will become a profit. They are not afraid yet and hoping they are right, they have no fear that their loss will become much bigger.
Only when the pain of being in a losing position becomes unbearable, do they act. As a group, you can see the footprint of their collective panic and emotionally driven action as price reverses on huge volume.
Emotions kill trading accounts. It isn’t the lack of knowledge that’s stopping you from winning big. It’s the way you handle yourself when you are in a trade.
I spent a decade observing traders lose money. They were intelligent people who often had great hit-ratios, but they couldn’t lose.
After reading this far, if you remember only one thing, remember this:
In trading, unlike life, the best loser wins.
THE £100,000 DAY
Like most people, I assumed by studying I would become a successful trader — and I’ve studied technical analysis.
They say you become an expert once you have done something for 10,000 hours. By the time my first decade in trading was over, I had spent 25,000 hours watching live charts, yet I was still nowhere near making the money I knew I could make.
The next decade was spent working with charts and my mental make-up in equal parts — Equal parts, with emphasis on mental preparation.
I remember my first £100,000 day.
To make that kind of money you need the right type of day — a day where the market trends in one direction all day from the open to the close.
I was short that day. The market kept falling and falling. I remember thinking only one thing: Where can I add to my short positions?
Just before the close, I closed out all my open positions and, when the day was over, it occurred to me I had not felt fear — not once.
I had stayed so focused in the present moment, so completely in line with the rhythm of the market, that when the market moved counter to my position, I used it as an opportunity to enter a new short position.
Not once did I think about buying the low. After spending years observing people trade, the most common mistake is trying to pick the low, so you can buy in cheap.
As a private trader, trading from home, £100,000 days like this don’t just happen.
You need to be ready on so many levels. When I look back over my trading diaries, I can identify five barriers, or road blocks that adversely affected my trading performance, and I didn’t begin to make good money until I understood their influence over me and how each one affected my decision making.
ROAD BLOCKS
Let’s talk about fear.
FEAR
Fear is unavoidable in trading and in life. Accept it.
Accept a certain level of anxiety is to be expected, as long as it doesn’t paralyse you.
Some years ago, while on holiday with my family, my young son fell into the swimming pool at the deep end.
There were four adults in very close proximity to him, as well as the lifeguard. I was fully clothed from a business meeting: suit, tie, the works. I was 20 meters away.
Time stopped. Before anyone could react or move, I had jumped over four sun loungers and dived feet first into the pool. My son was not in there for more than a few seconds before I had him safely back in my arms.
Like the adults who froze when my son fell into the pool, when I was trading, I had to learn to recognise the situation, realise the fear and react to it, much more quickly.
In trading, fear comes when you’re losing.
I had to learn to lose before the market gave a reason to be fearful.
This meant taking lots of small losses before any of them had the chance to manifest in a large paralysing loss.
Over time, I became an expert at taking losses, and once I did, counter-intuitively, my trading results improved dramatically.
Next, the main reason the majority fail.
HOPE
Hope is the main reason why the 95% never make money trading.
They hope their small loss will turn into a winner, never entertaining the idea their small loss will become a big loss, overwhelming and paralysing them with fear, leading to, more often than not, complete account destruction.
Hope and fear are two dancing partners that I had to learn to keep in balance.
In trading, it’s easy to be fearful and hopeful at the same time. I’ve spent countless hours visualising trading situations, running large profitable positions and managing my emotions in my mind, readying me for optimal personal performance when I trade for real — a technique I learned from Formula One drivers who also use this technique to enhance their performance.
Another trait you’ll need to overcome is what some call boredom, but if you go deeper, it’s nearly always this.
GUILT
Outside of trading, Western societal norms adhere to the Protestant work ethic.
We are programmed from birth that nothing is free, and you must work hard and be a productive member of society.
In short, when they do nothing, a lot of people feel guilty. And, when the market opens, they think they have to be productive and do something.
This is something I struggled with at first, and I had to really fight my desire to do something just because the market was open.
The mind doesn’t like to be idle, and to learn to still the mind is a lifelong endeavour.
At the beginning of my trading career, like a young over excited child, I threw myself into all sorts of trades without much thought of the outcome. I wasn’t trading to make money. I was trading to be productive.
Going over my old trades made me realise this flaw.
Some people might say they trade out of boredom, but that’s only the excuse, dig a little deeper, and you’ll find it’s nearly always guilt.
The market does not pay by the hour. A large part of trading success comes from doing nothing. My trading performance improved once I was aware of this trait.
The trading business attracts a lot of Alpha personality types who have been very successful in other areas of their lives, yet, Alpha, or not, one thing that needs to be kept in check is self-confidence.
CONFIDENCE
Over the years, I’ve observed myself and other trading friends go through transformations. Some of us have experienced great success.
Some haven’t. Some gave up for a while. Some persisted. Some had great results for a time, only to lose it all again.
You need to have faith that your process and your trade plan can generate consistent results. To trade well, you need to be confident.
You’ll need all your confidence when one trade after another ends in losses. Remember though, by starting right, by assuming you’re wrong, you are going to avoid the constant conflict, the confidence-sapping grind that 95% of traders are going through.
However, what I learned the hard way, the times I was most vulnerable was not when I was at my lowest.
I was most at risk when I was feeling overconfident, usually right after a big winning trade.
My biggest losing days always came after big winning days. Confidence is good. Overconfidence leads to ignoring your vital brain signals.
Put simply, when you’re overconfident, you’ll forget to flip the switch.
MARKET LOGIC
The financial markets operate perfectly, but the reasoning behind the movement is much more difficult to interpret when engaging with the market in real-time — so don’t try.
Even after two decades of trading, I am still surprised by what can happen.
On Christmas Eve 2018, I had one of my biggest trading profits ever, as the Dow Jones Industrial Average fell almost 800 points — even though the market closed early for the holidays.
I remember closing my positions via my mobile phone, as I tucked into my Christmas dinner, smiling.
It felt good.
Two days later, on the 26th December, the Dow staged the biggest one-day rally ever. I caught half of it, and then I turned to shorting again.
I remember thinking that logic had to prevail at some point, as the rally just couldn’t continue higher, but it did.
I lost because I expected the market to be logical. It isn’t.
And, as the old saying goes, the market can remain illogical longer than you can stay solvent.
FINAL THOUGHTS
One last thing, a word to the wise.
As a consistent, successful trader, you will continuously be at war with your in-built defense mechanisms.
You’ll have personal flaws, and trading is where you’ll find out what they are.
Accept them and work to neutralise them. I work on mine every day before I trade — even after decades in the market.
It’s impossible to completely remove all your flaws, so think of it as a continuous never-ending process. Don’t think you can “dabble” in improvement.
And don’t worry if you find out you’re not perfect because no one is.
Certainly not me.
Always remember, the perfect trade does not exist. So don’t try and fill a hole you can’t fill.
I’ve made many mistakes along the way; my success certainly wasn’t overnight.
I took years to break through the market dogma and my own personal biases to realise the elegant simplicity of successful trading.
Don’t underestimate what it takes to become a successful trader. It’s simple, but not easy.
Success is not found spending 25,000 hours staring at charts, it’s not found in software — no matter how expensive, in newsletters, indicators, or seminars.
It’s found by accepting we all feel pain when putting capital at risk and in giving up control and trying to be right.
By flipping the switch and assuming you are wrong and not right when you enter a position, you can neutralise the combative emotions that rob success from so many.
Fear, hope, boredom, overconfidence, and logical thinking are always there, waiting for the unwary.
Instead, success is found by flipping the switch. I wish you the best.
Tom Hougaard.
An Introduction to Price Action
By Tom Hougaard
1 Price Action – an Introduction
I am often asked what instruments and tools I use to trade with. I answer I don’t use anything. When I tell someone that I don’t use anything, they are often intrigued, so they will offer a plethora of suggestions:
Question: What about Stochastics?
Answer: Nope.
Question: Moving Averages?
Answer: No.
Question: Volume?
Answer: Nope.
Question: What about Fibonacci?
Answer: In day-trading, no. When I do longer time frame analysis, then I will consider Fibs. Question: So what do you use?
Answer: I use price action and mechanical entries.
Question: What does that mean?
Exactly! What does that mean?
I realise that price action means something different, depending on who you ask. I decided to put together a few pages to explain what price action means to me.
2 Definition of Price Action
I am not sure there is an official definition of what price action means. To me price is the raw data of a bar chart. It consists of 4 pieces of data: Open, High, Low, and Close. Price Action is the art of observing these data with reference point to your stored past observations in order to derive a high probability of what will happen next.
To be a price action trader to me is the art of reading the markets based purely on price data. So you may ask why I don’t use indicators. It is easy for me to answer that.
3 What are indicators made from?
I defend my decision not to use indicators by saying that all indicators are made from the mathematical structure of the following components:
1/ Price Data
2/ Time Data
3/ Volume Data
Think of the moving average – a favourite of many traders: it is made up of time and price. It is the average price over a set period of time. It uses time and price. I use time and price too. I just don’t have a line showing me the average price.
Think of Stochastics – an oscillator ranging from 0 to 100, attempting to alert traders to markets being “oversold” or “overbought”. It is made from 2 components: Time and Price. I use time and price as well. I just don’t believe that Stochastics gives me an edge. I don’t believe the market can be overbought without become even more overbought, and vice versa with “oversold”.
I could go on. From time to time (no pun intended) an indicator will use volume, but they are usually specialised pieces of software, such as “Volume Spread Analysis”, and they usually come with a healthy price tag.
4 A Typical Trading Day
I think the best way to describe what price action is, is to show it on a chart.
On the following pages I will explain the trading bars one by one. I have used a 5-min chart for this analysis. I like the 5-min bar, but you can use the principles of price action on any time frame.
The chart below is that of the German DAX index from the 25th October 2016. For now you will only see the first hour of the trading day. By the time we join in on this chart, the market has been open for 25 minutes (counting from when the underlying stocks opened).
Although I don’t use indicators, I do believe the market has “memory”. It means that the market will remember past important price levels. So for example, yesterday’s high and low will be important for me to know about ahead of the trading day.
Below you see the chart from the day before. You can see the market making a strong start to the day. At the price of 10,820 the market is meeting “resistance” in the form of selling. 2 hours later the market attempts to trade near the 10,820 level again, twice, after which the market reverses. The market loses all its gains from the day. You can conclude that at price 10,820 there were more people interested in selling than in buying.
As we head into the trading day, we are aware of the importance of 10,820 as well as the low of 10,755.
Turning our attention to the chart below, the next bar is a BULLISH bar. It closes near the high of the 5 minute bar. There is very little “tail” on top of the body of the bar. The low of the bar is higher than the previous bars low. It also breaks out above the highs of the last 4 bars. The message I receive from this bar is:
- The market is strong
- The market is able to break above the last 4 bars high.
- The market is closing near the high of the bar.
- All is well, UNLESS the low of the bar is exceeded. This would mean that there was not enough strength from the buyers to absorb the sellers.
- I would expect the market to test the highs of yesterday.
The next chart shows how the market goes into a sideways consolidation. Bar 1 is the long blue bar. Bar 2 is the next bar, and so forth. You can see how bar 2 in the sand coloured box makes a higher high and a higher low, but it has a negative close.
In my experience you often see corrections take the form of 2 waves. However, as I am writing this material, I realise how dangerous it is to make a statement like this. The market can do whatever the market wants to do. It can make a 1-wave correction. It can make a 3-wave correction.
I think every bar tells a story. Is the market bullish? Is the market bearish? Is the market marking time? I am constantly aware of the small nuances that the market is telling me.
For example from the chart above, I have cut out the box which shows the consolidation. I will refer to them as bar 1 to bar 5. The first bar is the long blue bar.
Bar no 3 makes a lower high and a lower low. I understand that this may not be what you consider a “lower high lower low”, but when it comes to trading price action as a day-trader, I do pay attention to this.
Bar no 4 make a lower high, but it also make a higher low. The 5th bar attempts to
push the market down below the low of bar no 4, but it fails.
When the market is in a strong bull trend, which it is on this morning in the DAX, I
would expect the market to at least make a re-test of the highs.
This leads me an important observation: The market has a tendency to only
reverse after the important price levels have been re-tested.
The next bar on the chart above is a bar that tests the highs of the previous day. It is a great example of how the market has memory. Of course it isn’t the market that has memory, but the traders buying and selling. They remember past highs and lows (or they look at the chart).
The low of this bar is still higher than the previous bar. It also broke above the last 5 bars highs. Although it has a long tail, I still expect the market to continue to move higher.
Only if the market begins to trade below the low of the bar will it potentially change the tune of the market. In my courses I teach a setup, which preys on situations like this. However, this would require that the market closes below the low of this bar.
The next 3 bars show an inside bar, a big spike higher – which fails, and a “neutral” bar. The spike will be interpreted as bearish by many traders, but this is not always the case. What is significant about this bar is that it pushed above the previous high (from yesterday), and it failed to gain follow-through. However, the trend is still very much bullish, and there is no discernible weakness yet.
It means that short positions at this point are highly speculative. Traders who engage in short positions at this point will have high risk (of being stopped out – but small monetary risk) but also a good reward prospect as the target would have to be the opposite end of the trading range.
5 Explanation of Target
Let me explain that quickly: When the market has exceeded an important price point, either to the upside or to the downside, but it FAILS to follow through, the target (the magnet) is the opposite side of the trading range.
Here is an example (on the next page) from today in the FTSE index. I am currently short the FTSE because of the price action pattern you are seeing here: Market made a top, fell, rallied again, and failed to make progress above the old highs. I shorted when the market closed below the horizontal black line around 11:40am. My target is the old low. It may not happen, but that is the “magnet” of the market.
This took place on a 1-min chart. I often use the 1-min chart with the 5-min chart. The signals come quick on the 1min chart. My risk is small in monetary terms, but the risk of being stopped out is high. However, the potential reward is much bigger than the risk. I estimate I need to risk 8 points here. I have the prospect of 25 points.
At this point I have already placed my stop loss at break-even.
When you consider the simplicity of this approach, you also have to ask yourself a basic question: How many times does this happen across all the FX markets, the commodity markets and the index markets alone in a week?
Obviously I can’t give you an exact number, but it happens a lot!
6 A Typical Trading Day – continued
Back to our price action examples on the DAX…
The next bar is another push higher. There are still buyers about, even though the market made a bearish Doji (Candlestick terminology). Do you notice the 3 circles in the coloured area?
I have shown in the sand-coloured area the same chart as you see on the left of the chart. The 3 circles highlight the 3 most important bullish bars on the chart. What I notice is that at no point have the lows of these important bars been tested. At no point have the market traded below the lows of the big bullish bars.
I also notice the small trend line I have drawn is being penetrated, only to fail. When I see that pattern, I will focus on what happens afterwards. In this case I will focus my attention on the lows of that candle. I will most likely want to sell short the market, if the price trades below the low of the candle which has broken up through the trend line, but failed to carry on higher. I will either have an order lying waiting underneath the lows by a few points. It means that if the market reverses down, I will automatically be pulled into the trade. The stop-loss will get triggered automatically too.
You may take the next sentence with a pinch of salt, but have you ever heard about the pattern called “3 pushes”. Many patterns are simply a way of categorising observations into easy-to-remember clues about the market.
The DAX has here pushed higher in three separate pushes. However, before you line up the big short position, you have to look at the chart on the previous page and conclude that it is a bullish chart. It is only because you know the market has just tested the highs from yesterday that there is reason for caution. However, most resistance fails, eventually!
7 Geometry of Trading
I studied geometry of trading for many years. The topic is captured so well in a book by Larry Pesavento called Pattern Recognition with Fibonacci Ratios. I may not use it in my day-to-day trading, but I am certainly aware of it, and I use some of the tricks from this particular form of market analysis.
One item I can recommend is the use of “measured moves”, sometimes known as “1 to 1”, sometimes known as “equal retracements”, sometimes known as “harmonic moves”. In Denmark we have a saying: kært barn har mange navne. Translated it means that a sweet child goes by many names.
On the next page you will see an example from a previous trading day of a Harmonic Retracement. I use it for several things:
1/ It gives me a good place to position my stop-loss on my longer-term positions. The idea is that you need to give the market space to breathe, so to speak. So by placing the stop-loss outside the range of the last retracement you give yourself a good chance of not being stopped out. Should you get stopped out, it often also means that the trend has changed. This is called “over balancing” – obviously an expression from the world of geometry. There is no longer balance in the retracements.
2/ It also gives me an entry signal. If I bet the current retracement will be equal to with the last retracement, then I know exactly where to place my entry order.
This leads me back to the charts of the DAX from the 25th October. I am still bullish overall, but the market has now closed below the low of the bar, which tested the highs from the previous day. This is normally a bearish development, and it requires a short position, with a stop loss above the highs of the day. The flip side is that the
market hasn’t really shown any real negative tones yet. I could at this point place a short position for a swing lower, and buy the DAX on a harmonic retracement. Either and both are valid.
8 Reversal Day or Trend Resumption
At this point we don’t know if the market will resume its trend up, or if it will reverse down. Here we see 3 bars in the sand-coloured box. They are a close-up of what you see on the chart to the left of the box.
If you look carefully at the last 7 bars, you will see the following:
1/ the market has made lower highs and lower lows on three consecutive bearish bars. The 4th bar is a higher low. This higher low fails, and market continues lower, creating a two-wave correction.
The second last bar is the bar I am interested in. This is a potentially bullish bar for a scalp trade. It is an inside bar, i.e. it has a higher lower, but it doesn’t have a higher high. If the market breaks above the high of this bar, it is good for a scalp trade.
The next bar, the last bar you can see, shows the market make a move higher, and it enables me to make some observations of the market:
1/ the market may have seen a top, as it failed to push above and CLOSE above yesterday’s high. A short signal is in play now.
2/ the market is not showing any material weakness yet. Only a move below the price of 10,805 could set a movement lower.
9 Some Explanations – Scalp Trade – Extended Bar
What is a scalp trade? It is my attempt to take a few points from the market. If the market reacts well, I may sit with the trade. I am often using orders to get into the market on scalps. For example in the example above I used an order to get in on the long position, on both the harmonic Buy Signal, and on the inside bar breakout – after ab-cd move. An ab-cd move is another word for a two-wave correction.
What is an Extended Bar? An extended bar is a bar which has very little “tail”, and which is visibly bigger in body than the candles which comes beforehand.
The Dax rallied for 15 minutes and then reversed. The last bar you see in the sand-coloured box is an extended bar. It is not the best looking EB I have seen, but it is close enough to being perfect.
The DAX displays a harmonic move higher, in line with the last push higher to the top (nearly). The DAX then breaks below the last swing low. I see this as a SELL SHORT SIGNAL. At this point I can guarantee you that a Stochastics indicator would suggest you buy. It would have gone “oversold”.
After the short signal there is some follow-through, followed by two blue bars. At this point I will have a stop-loss above the high of the Extended Bar. If this means using a larger stop, I will decrease my stake size.
I would not be tempted to exit my short position because of the two blue bars. It is perfectly normal to see some retracement after an Extended Bar. At this point in the trading day, with the DAX trading below 10,800, and making lower highs and lower lows, the trend looks set for lower prices.
10 Managing the Position
I use a technique which trails the stop lower. It is a simple technique.
If the current bar goes below the low of the previous bar, I will move my stop loss down to the top of the current bar. If it doesn’t make a new low, then I will leave my stop loss alone.
If you study the sand-coloured box on the next page, you will see a close-up of the last 8 bars. On the way down I trail my stop, but I only move my stop loss if the bar makes a new low.
An Extended Bar that comes after the market has already trended for at least 10-15 bars is more often than not an “exhaustion” bar. If you study the move higher in the morning, you will see that after every Extended Bar the market pauses before moving higher.
The same happens more or less on the way down. The last Extended Bar on the chart below comes after the market has already trended for an hour. Therefore, if I am not already short the market, I would be hesitant to short here, even though the bar is negative.
11 A Brief Tale from a Master
One evening I sat and traded with Bryce Gilmore. He is the absolute wizard of geometry trading. Incidentally Larry Pesavento and Bryce Gilmore are best friends and shared an office and trade together. On this evening Bryce had a short signal, but he didn’t take it. I asked him what he was waiting for, and he answered: “I am waiting for the market to paint a red bar on the 1min chart. That way I know there is some weakness in the market.” Wise words.
The rest of the trading day is displayed on the chart below. I have highlighted with black horizontal lines some of the trades I have taken on this day. I don’t deny that this is an intensive form of trading. It suits me.
12 Price action on Different Time Frames
Price Action can be used on any freely traded instrument. On the chart below (next page) you are looking at Crude Oil on a 10min chart. It is day of 4 distinct stages:
1/ initially a Trading Range Day (TRD)
2/ market break down at 10am. The bars are predominately bearish bars.
3/ a tight channel marks the retracement of the bear trend – then resumes trend
4/ a trading range again
Although this is a chart from a commodity rather than an index, it can traded exactly as I would trade an index. On the chart above, which is a 10min chart rather than a 5min chart, I see:
1/ a harmonic retracement around 18:00
2/ a failed breakout at 18:00
3/ an extended bar at 08:00
4/ a harmonic retracement around 12:00 which is equal to retracement at around 10:00
13 In Closing
I hope this gives you some appetite to study Price Action further.
I run 1-day and 2-day courses on trading techniques and price action. You can read about the course on my website www.tomhougaard.dk
Happy Trading
Tom Hougaard