Dax & Dow Index Breakout Strategy
This document discusses a breakout strategy which on paper and so far in reality has yielded positive results. The strategy is applied on the DAX index open (9am Europe time) and the Dow Jones index open (09:30am New York time).
Naturally breakout strategies can be used at all hours. This one is focused around the open of the European and the US markets.
I have used the strategy on the broker TD365.com, because the Bid Ask spread is tight, but any broker with a reasonable Bid Ask spread can be used.
This document is written over the weekend of the 7th – 8th August 2021 – by Tom Hougaard. The document has been amended for mistakes on the 13th August 2021.
A while ago, I was contacted by a new trader. He wanted me to evaluate a system he had bought. It was a breakout system. He gave me the parameters to the system. He then asked me if I thought it was a plausible strategy.
Initially I thought it was a heap of crap. However, it gave me an idea to use the volatility at the open of the Dax index and the Dow index to my advantage.
So, I created a similar but more profitable system. I realise that some people love a simple “set and forget” system. This will work well.
I need to address a couple of issues before I tell you the system parameters.
Slippage
What is slippage?
Say you have a stop loss on a long position. The stop loss is 14,980. Imagine you then get stopped out at 14,977.
That is an example of slippage.
Slippage is a bit of a hot potato in the CFD trading industry. Some brokers are worse than others. I accept that slippage is part of my job description. However, I expect my broker to “slip” me both ways. Let me quickly explain what I mean by that.
The first time I heard about asymmetric slippage was when FXCM was fined $16.9m for systematically cheating their clients through slippage.
If you Google “asymmetric slippage fine”, you will see how more than one broker has fallen foul with the regulators over how clients are treated with respect to slippage.
EXAMPLE
Let me give you a quick example of what some of these naughty brokers were caught doing.
# A trader buys DAX at 15,000. Stop loss is 14,980.
# A quick movement causes the market to trade through 14,980 without any transactions at 14,980. The first traded price is 14,977. So, our trader friend should be filled at 14,977. He has suffered a 3-point slippage.
# Another trader sells short DAX at 15,000 at the same time. He has a take profit target of 14,980. If the broker fills the client at 14,980, then they are committing a foul. They should fill the trader at 14,977 (exclusive the spread).
CFDs vs. Futures
The strategy I want to teach you – like all breakout strategies – is pretty simple. It normally doesn’t come with a huge success ratio, unless you play it smartly.
It does lead me to another important point, which I think we need to discuss first. It is the point about CFDs and CFD trading vs say futures trading.
What is a CFD?
Well, a CFD is essentially a contract to trade, like a futures contract, but you are not trading with the exchange. You are trading directly with the broker.
There are some advantages to that.
- You can trade in a size that suits you. Futures contracts have specified contract sizes. So, beginners can trade small – very small actually, and people like me can trade big, very big actually, without necessarily getting fill slippage.
- The broker will add liquidity, meaning that I will be able to say trade £300 a point in the FTSE at a 0.4 spread, even though the underlying market is at 0.5 at a minimum, and most certainly not in £300 a point – which is equal to 30 FTSE futures contracts.
- CFD brokers also offer you much greater leverage than a traditional futures broker can. Usually, and forgive me if I am wrong here, I think futures are traded at 10 to 20 times leverage, while CFDs can be traded at 200 times leverage.
- Another nice advantage to CFD accounts is the Negative Balance Protection, which means you can’t lose more than you deposit on your account.
Now, the key take-away here to me is that you are trading with a broker, rather than an exchange. So, you need to be mindful about that, and ask yourself, why would the broker offer to be the middleman?
The answer is simple. They do it because they think they can make money from it. Even though they are essentially passing on the data from the financial markets straight to you, and they act as a middleman, meaning that you can trade on the market prices in real-time but with the broker as a middleman (meaning your buying and selling will not show up in the market volume), they believe they can make money from you.
Breakout Strategies
What is the relevance of the long paragraph about CFD brokers and now talking about breakout strategies? Well, we will get to that in a moment.
Say the high of the day so far in the DAX is 40. If we differentiate between the “real market” and the “CFD market”, we must appreciate that the CFD broker like the real market will show the market price at “40”.
However, the real market may only show say 10 contracts for sale at “40”, while the CFD broker in theory could have all their clients buying a million contracts at 40. This is obviously not a realistic proposition. The CFD broker would themselves hedge out that risk, and any slippage they suffered, would be passed on to the client.
But to some extent, the CFD broker will add some liquidity, but only to some extent. That is the risk the CFD broker runs. It essentially means that a breakout strategy could be profitable with a CFD broker but not profitable with a futures broker.
I repeat:
A breakout strategy may be profitable with a CFD broker, but not with the real futures market broker.
How come, you ask? The answer is slippage.
Say you want to buy 10 DAX contracts at 40. That equates to €250 per point in risk. If you are a futures trader, trading DAX futures at EUREX through a futures broker, you might get filled partially at 40, and more at 41 and the rest at 42.
If you are a CFD trader, you MAY get the whole fill at 40, depending on your trading size. You may also find that the CFD broker will apply slippage themselves.
Say your order is at 40, but the first print at the open is 44. Whether you are trading with a CFD broker or a futures broker, you will get your fill price at 44. That is the essence of what I am trying to convey to you.
Now let me move on to the system itself.
Skewed Risk Reward Profile
A skewed risk to reward profile is essentially an asymmetric risk to reward profile. It means that I will risk more than I am looking to make. So, I might risk 10 to make 5. That is fine, but then the success rate needs to be better than 50/50.
If I am right 7 times out of 10, I will make 35 and lose 30. It might not be a barnstormer of a strategy, but it is profitable.
Breakout systems tend to have only a 40% chance of actually breaking out. Remember that the markets suffer from INERTIA. It means it will tend to continue to do what it has already done. However, there is one major exception to this rule.
The exception to this rule is when the markets open.
Consider a system where you monitor the market ahead of the open. This is called the “pre-market.” The DAX opens at 9am in Frankfurt for trading, but the futures market based on the DAX stock index has been trading for a good 8 hours before that.
The futures market factors in news and Asian sentiment and sentiment from the US market the night before. This melting pot attempts to give an indication where the DAX index will open at 9am European time.
However, the “pre-market” often gets it horribly wrong, which is where a breakout strategy (bullish or bearish) can come in handy.
System Details
For the ease of “time symmetry”, we will assume that the DAX stock index opens at 8am Greenwich Mean Time. If you live in Europe, for example, where the DAX is trading, this will be your 9am. This is the local German time for the open of stocks.
On my documentation charts you will see I have circled 8am as the open. It means you will observe the DAX index from 7am until 7.59am, which I call the “pre-market”.
Can you use this method on other indices than DAX? Well, I tested it on FTSE. I am afraid that is a no-go. So, the documentation here is for the DAX and the Dow. This breakout method does not work on the FTSE index – according to my research.
Let me take you through an example of the breakout system.
The chart below shows a 15min chart of the DAX from 7am until 07.59am.
The high for the 59 minutes of trading from 07:00am until 07:59am was 40.
The low in the same 59 minutes period was 20.
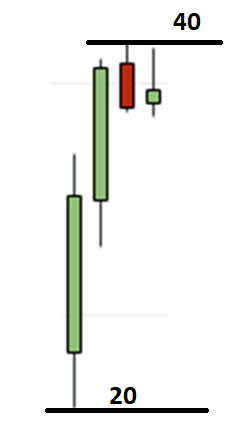
The breakout system is now betting that once the market opens, it will surpass one of these two levels very quickly. It will race past 40 or it will drop below 20. It may continue to rally above 40 or it may reverse shortly after into the range set in the hour before the open. It may drop below 20 and carry on going, or it may reverse back up again.
My point here is that ANYTHING can happen.
Your job is not to predict what will happen. Your job is to be ready for the 8am open with orders to BUY at 40 or SELL SHORT at 20.
What is interesting here is the size of the profit target and the size of the stop loss. You will risk no more than 9 points. Your profit target will only be 6 points in the DAX. For the Dow I have changed the parameters to risk 9 but also make 9. We will cover the Dow index in more depth after we have explored the Dax Index.
Checklist for the DAX index
Let me put the rules into an easy-to-read format:
- Observe DAX pre-market from 7am until 07.59am.
- Mark the high and the low of those 59 minutes of trading.
- Place a BUY order at the high of the 59 minutes observation period.
- Place a SELL SHORT order at the low of the 59 minutes observation period.
- This obviously needs to be done in the minute before the market opens. You need to be quick.
- You risk 9 points.
- Your target is to make 6 points.
- If one order is filled, I cancel the other. Some do not. I do.
NOTE ADDED THE 13TH AUGUST
TD365.com now has “orders on charts. I have added this page to the documentation which is published on my Telegram page (Live Trading – Trader Tom) under the file section of Telegram.
Normal document below:
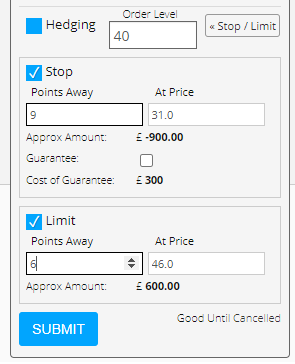
I am using the TD365.com trading ticket to illustrate my point. You can use this method on any CFD brokers platform. However, I am not sure how other brokers will treat you with slippage.
The trading ticket – again using the TD365.com as an example, but one which should be identical with whoever you decide to trade with – is filled out below with an example. Here the price entry level is set at “40” with a stop loss at “31” and a take profit target at “46”.
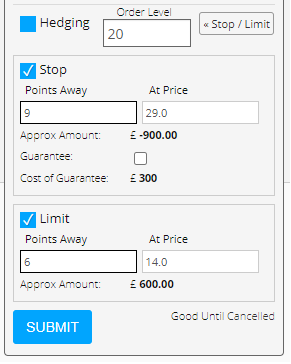
Below is the order ticket for the SELL SHORT order. The ticket sells short at “20” with a stop loss at “29” and a profit target at “14”.
This system actually works well, although you need to be mindful that not all brokers will be treating your order equally. You may get filled at “40” (or “20”), but you may get slippage, which means you may get a worse entry price. You may even get a worse stop price too.
Let show you the documentation from the last 14 days. I would normally show documentation for months and months. However, TD365.com only shows 1min data for the last 14 days.
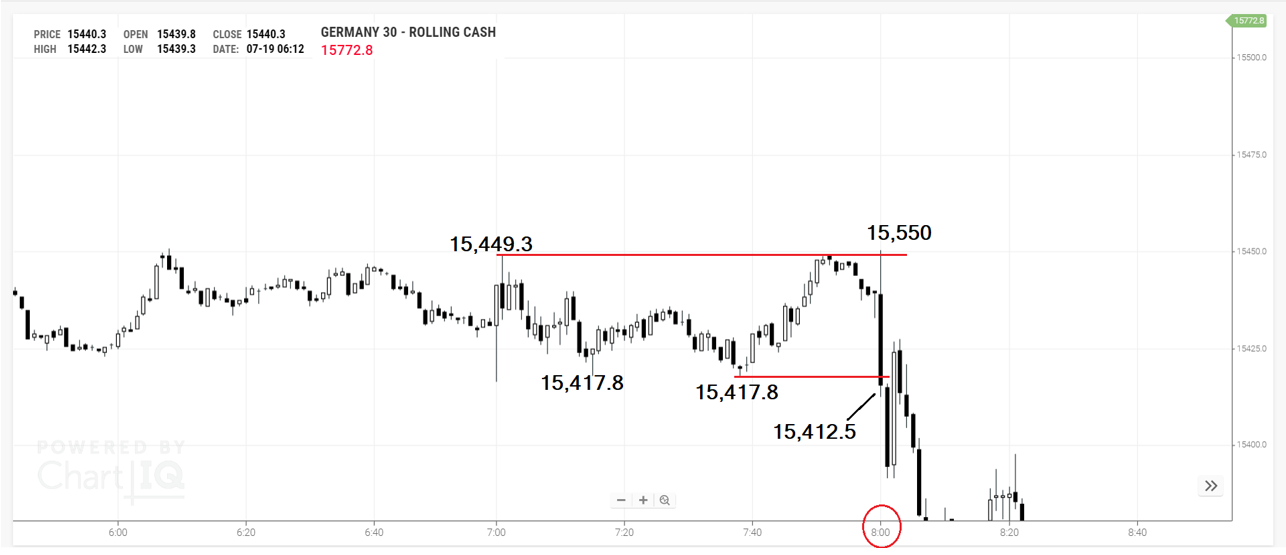
19th July 2021
The high of the pre-market is 15,449.3. The low is 15,417.8.
At 8am (9am in Europe – when DAX index opens for share trading), the market briefly spikes up to 15,550. Your order will be filled, and you would have lost 9 points.
Notice what happens when the market moves below the low of the pre-market. Your order at 15,417.8 would have been filled. You would have made 6 points. Truth is you would have made more, had you stayed in.
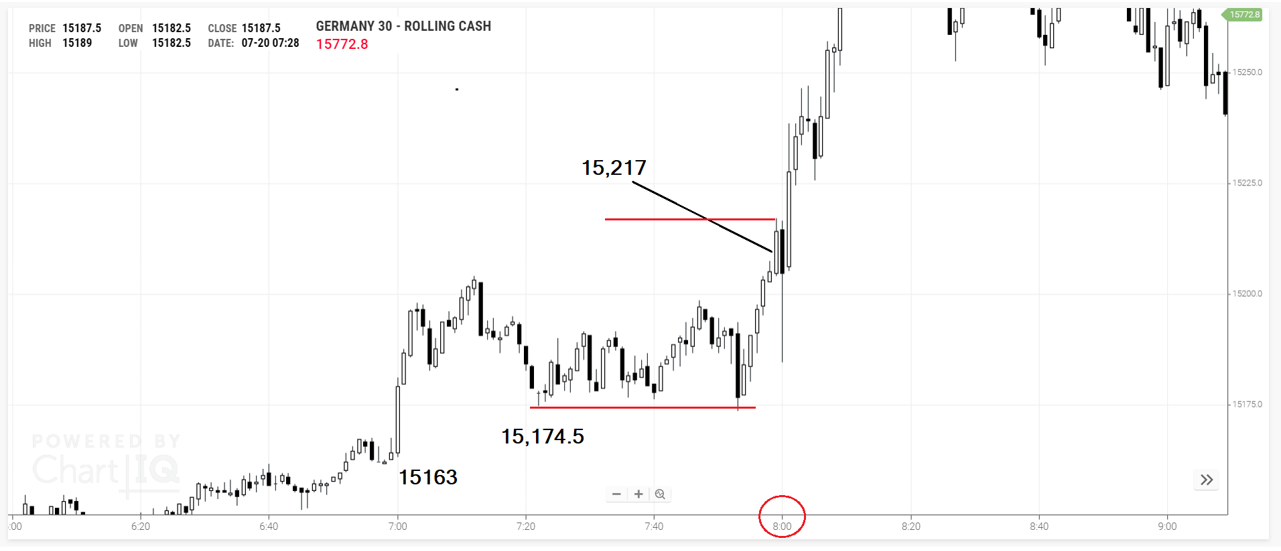
20th July 2021
The low of the pre-market is 15,163. There is a compelling and more convincing secondary low at 15,174.5. Neither of these levels became relevant, but I am putting the data in front of you because I think it is possible to optimise the order entry, if there is a more compelling support or resistance area than the high or the low of the 59-minute time window before the market opens. It certainly was the case on the 20th of July.
The high is 15,217. This is set just as the market opens. The first bar at 8am is marginally lower than the bar before, meaning your order would not have been triggered. Otherwise, you would have lost 9 points. 1 minute later the market storms through your order, and you are 6 points richer.
Why 6 points? Well because having looked through the last 3 months (63 samples – too little in my mind – but the conclusion supports the argument), when the DAX breaks the high or the low of the pre-market range, it will do so 9 times out of 10 by at least 6 points.
So, you may be thinking: GREAT – a profitable system. I will win 9 times with 6-point profits, and I will lose once with an 9 point loss. Anyone with a basic knowledge of maths can see that is profitable.
Stop. Not so fast.
This does not consider how your broker will treat your orders. Be mindful of that. You also need to be mindful that the market needs to be volatile for this to work. AND you need to trade with a broker that has a decent spread in the DAX.
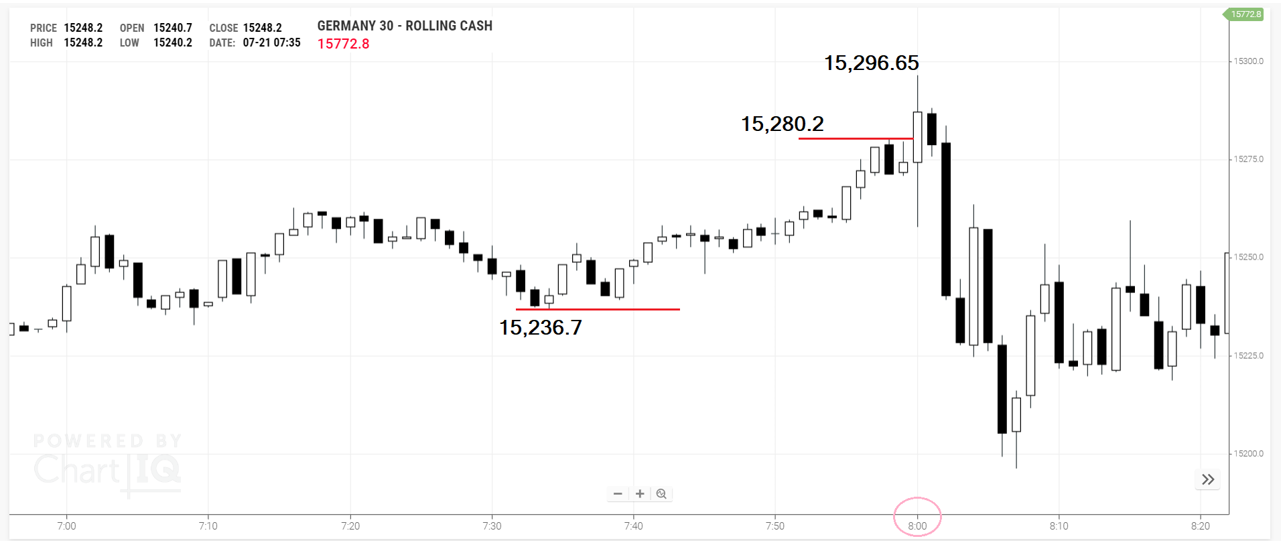
21st July 2021
The low of the pre-market is 15,236.7. The high of the pre-market is 15,280.2
Two orders are placed in the final minute ahead of the open.
Buy at 15,280.2. Sell short at 15,236.7.
The DAX opens at 8am. The market quickly moves up to 15,296.65. The 6 points have been earned.
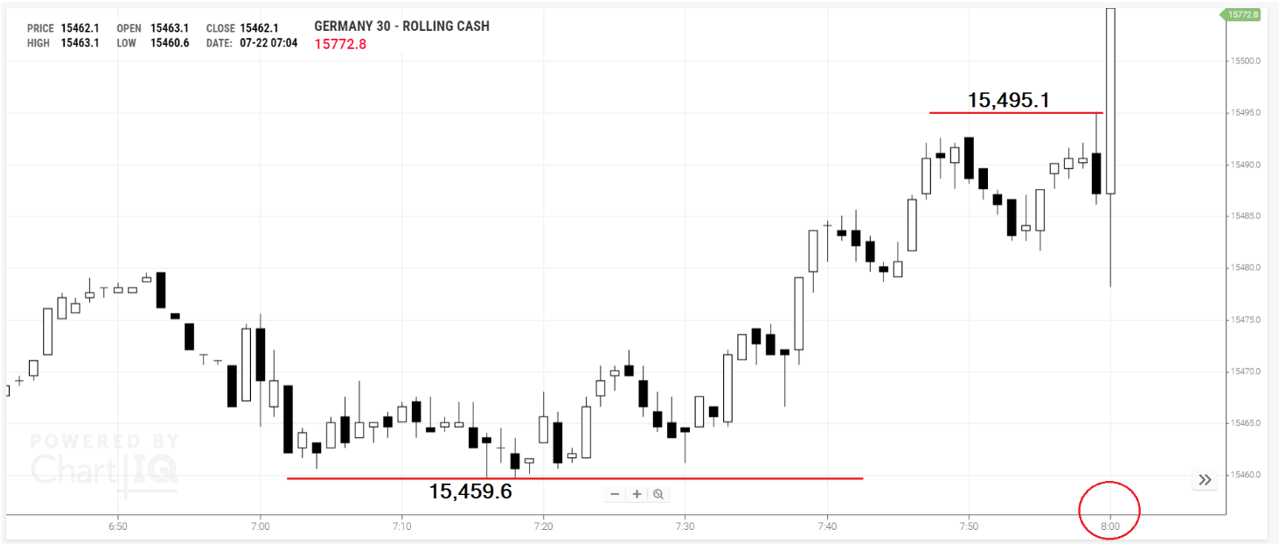
22nd July 2021
What this chart doesn’t say is this. Did the DAX move above 15,495.1 for a bit, then moved lower, and then moved higher? You see, if you purely rely on the chart as your evidence, you may conclude this was a profitable setup for the breakout strategy.
However, the DAX could easily have moved to 15,496, then moved down to 15,478, and then moved higher, all in the 1min bar. Thus, you would have lost 9 points. It didn’t, but my argument here is that you can’t necessarily rely on the chart alone.
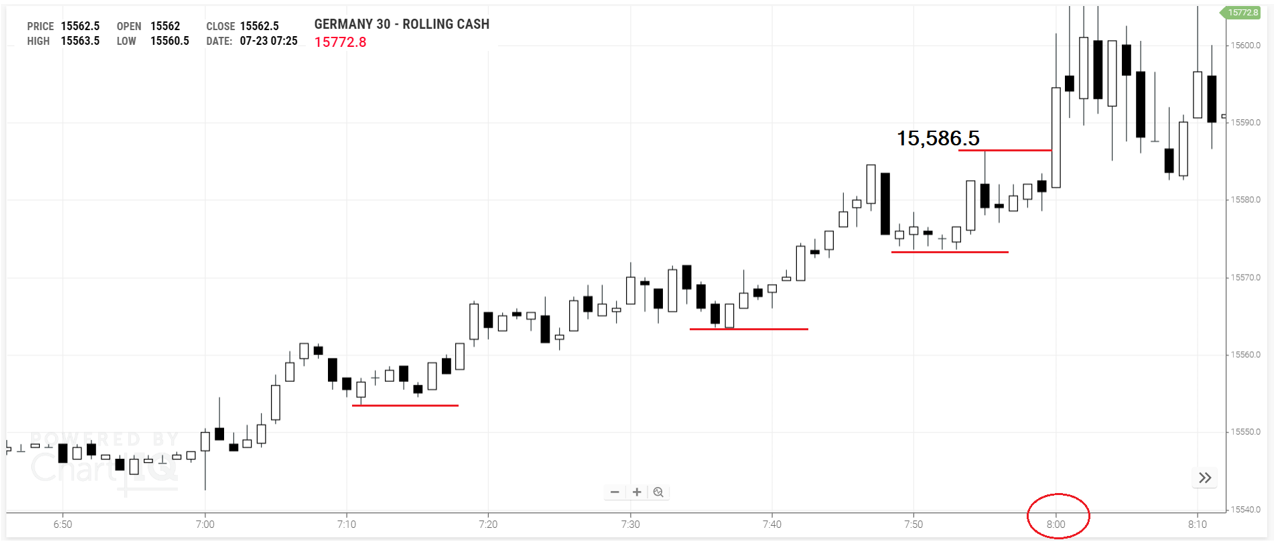
23rd July 2021
I have market a series of support levels during the 59-minute window. None were triggered. When the market opened at 8am, the DAX blew higher. 6 points made.
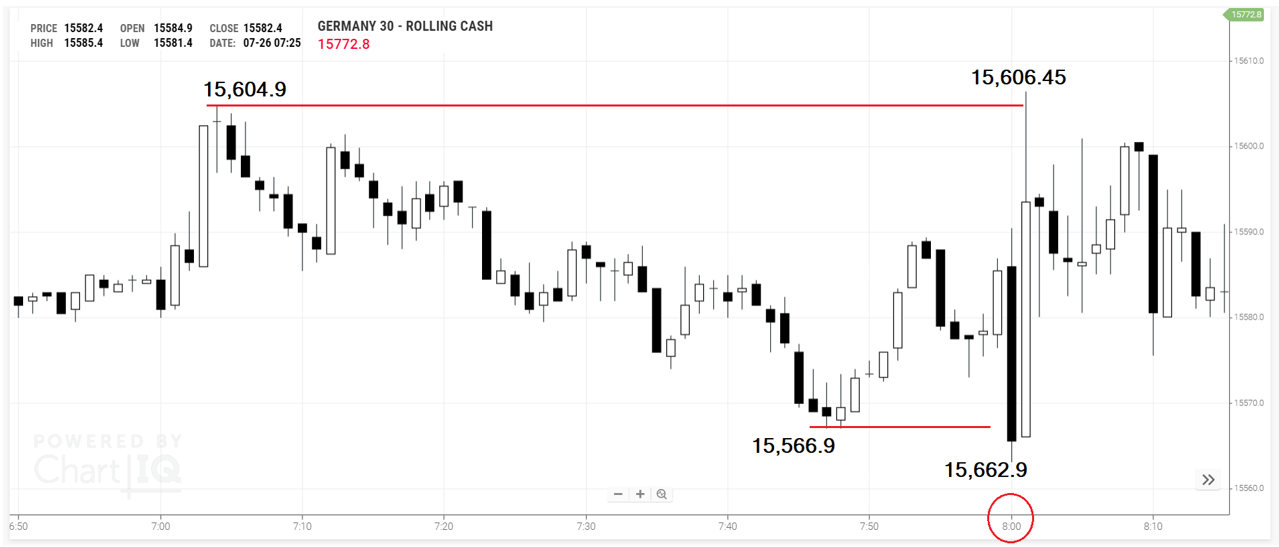
26th July 2021
The low is 15,566.9. The high is 15,604.9.
When the market opens, it takes your short order at 15,566.9. So, you lose 9.
If you have bought at 15,604.9, you would also have lost.
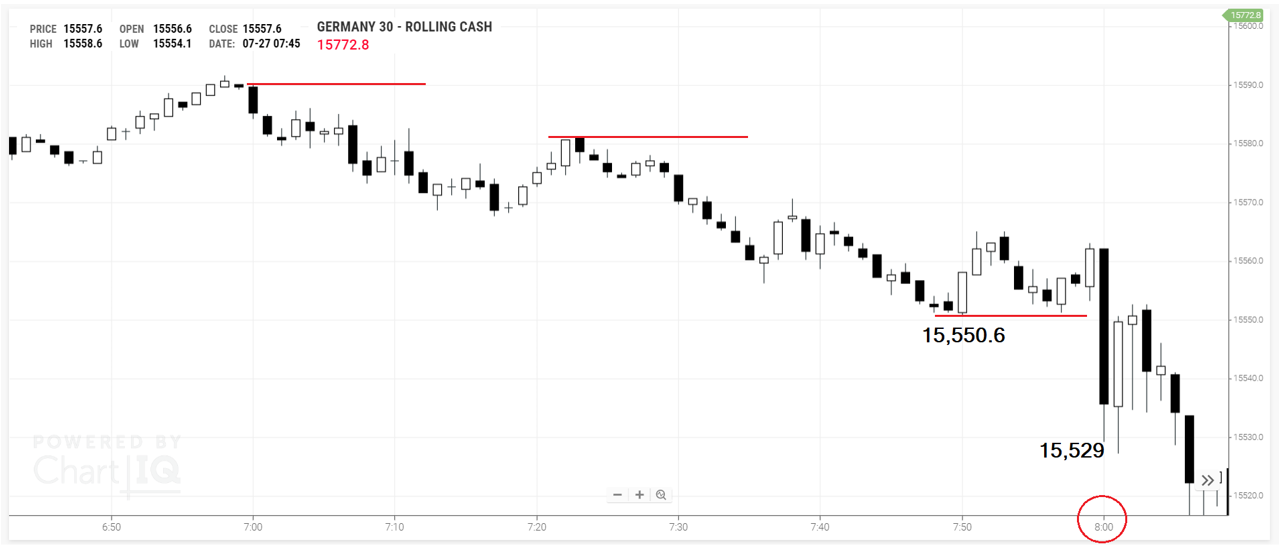
27th July 2021
One thing I have not discussed so far is the merit of a 6-point profit target. Is it a good idea? I don’t want to put words in your mouth. How would you feel about making 6 points, if there perhaps were 15 to be made? Well, you would never find out, because you took your 6 points. If you didn’t, the risk of losing 9 is there.
It depends on what you want to achieve. If you are trading this system, and you do so in say €100 a point, you might be happy making €600 about 4 times a week, and then lose €900 once a week – theoretically speaking.
Here the SELL SHORT order would be triggered at 15,550.6 and the 6 points were bagged safely. There was 21 to be made – minus spread and slippage.
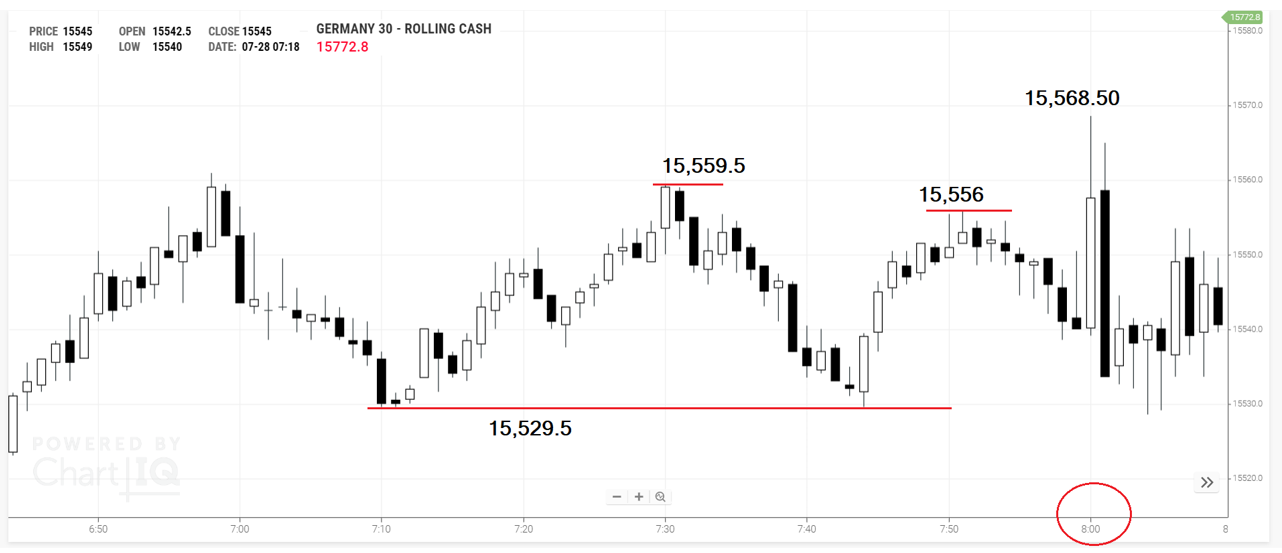
28th July 2021
This chart has two levels where a buy order could have been triggered. Either way the 6 points were in the bag.
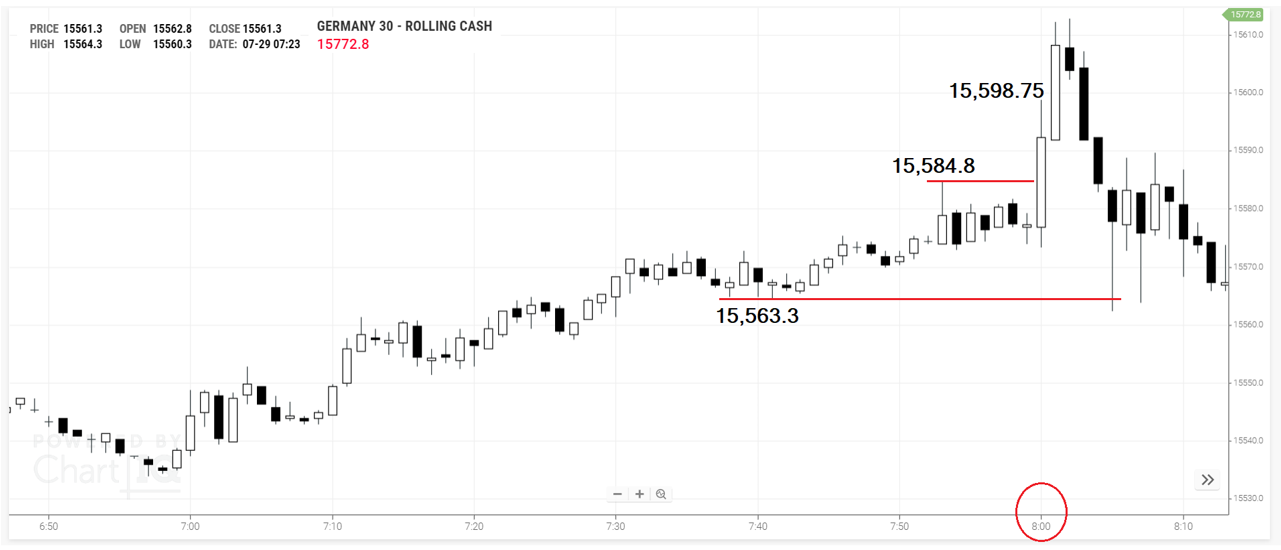
29th July 2021
6 points made. Job done. As always, you can see how much you are leaving on the table. Maybe you want to play around with “trailing stops” or perhaps input one order with a 6-point target and one with a larger target, based on your observational evidence.
Just remember two things:
1/ Slippage
2/ Larger profit target means lower strike rate
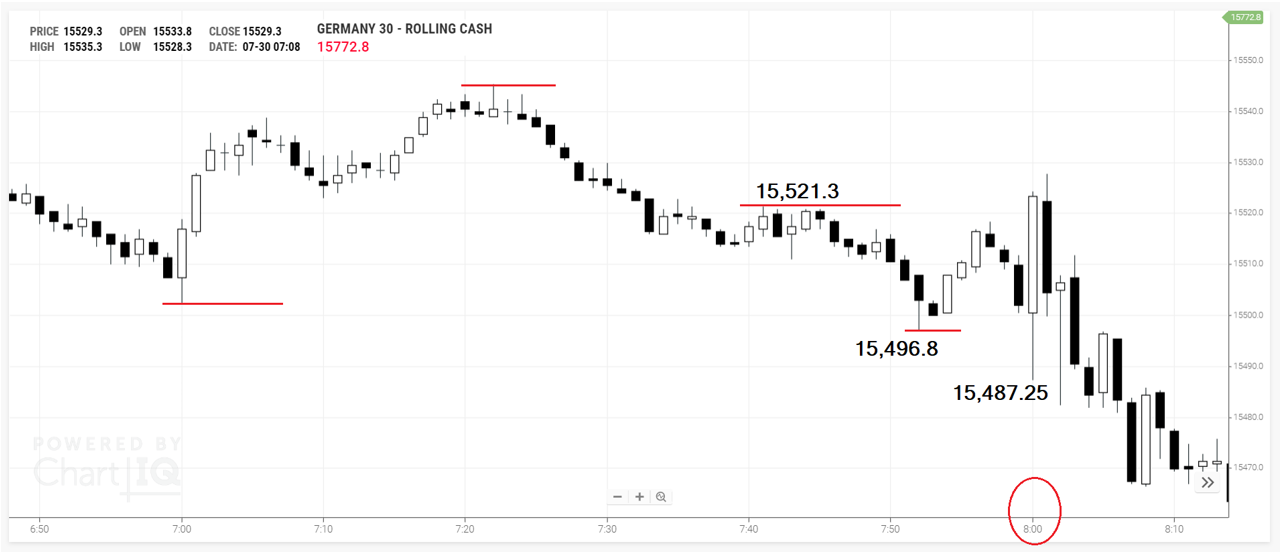
30th July 2021
6 points made – but you have had to been there to know that.
The chart doesn’t tell you if the DAX went below 15,496.8, took your sell short order, then reversed higher before hitting your profit order, then stopped you out, before then actually surpassing your original entry point by 6 points plus slippage and bid-ask spread.
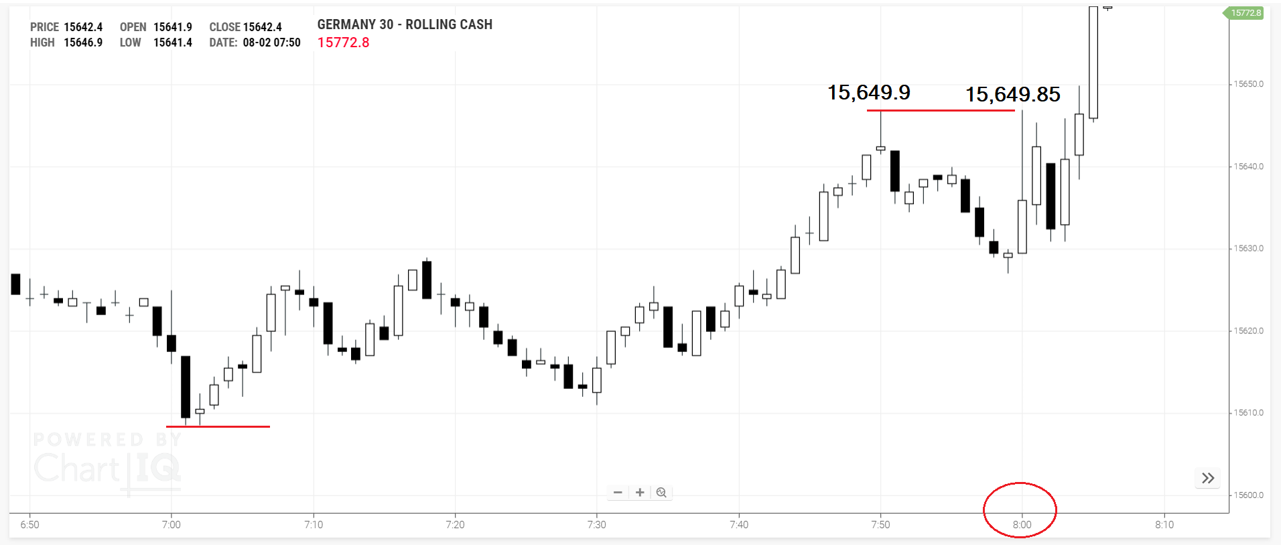
2nd August 2021
9 points lost. Yes, unlucky. Yes, there may be a case for investigating if the entry order needs to be 1 point beyond the high/low of the 59-minute pre-market window.
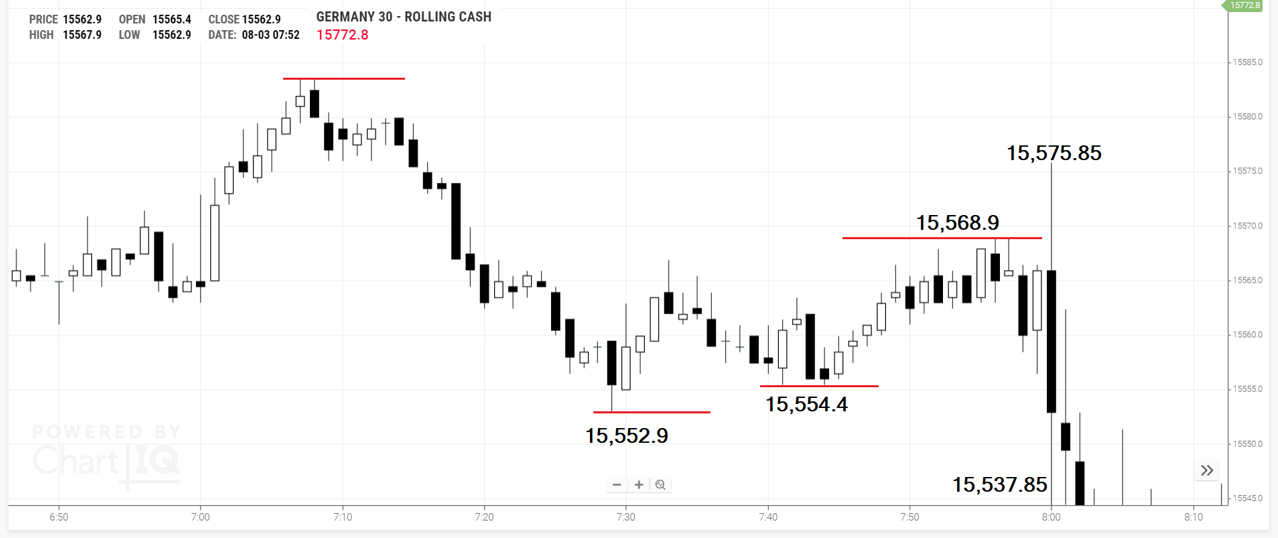
3rd August 2021
6 points won.
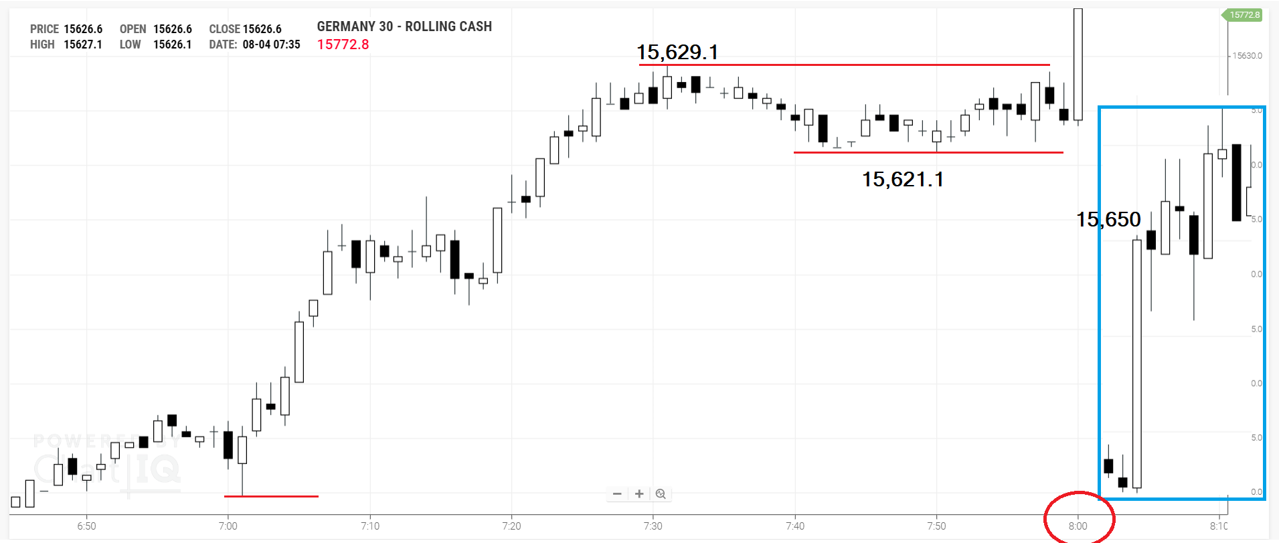
4th August 2021
The snapshot in the blue frame is just to show you how much more than 6 points were on the table. The market stormed in a straight line to 15,650.0
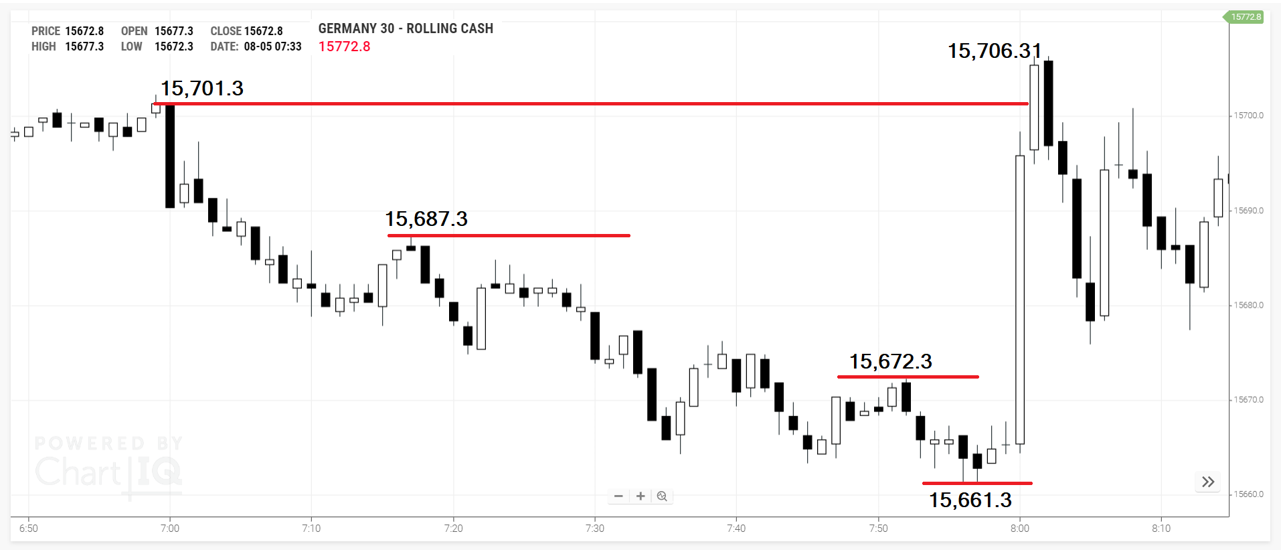
5th August 2021
This is an interesting chart. The low is 15,661.3. The high is 15,701.3. The DAX opens and actually storms higher immediately. 6 points would be made at 15,687.3 entry. With such a wide difference between the high and the low, it begs the question if an “earlier entry” could be warranted. Otherwise, this is probably a loss of 9 points.
Food for thought.
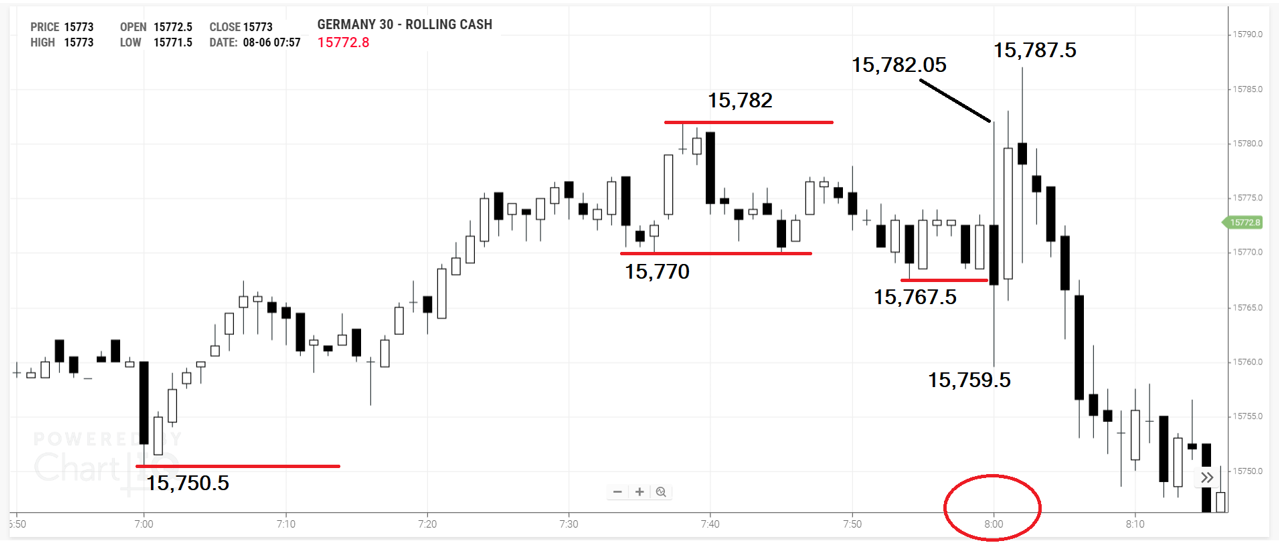
6th August 2021
The 6 points were made. Had the DAX moved up first, then you would have lost 9 points on your long order. It is also a great chart remind us, should we be tempted to explore this strategy, that you need to remove the other order quickly, unless you want to risk 9 points.
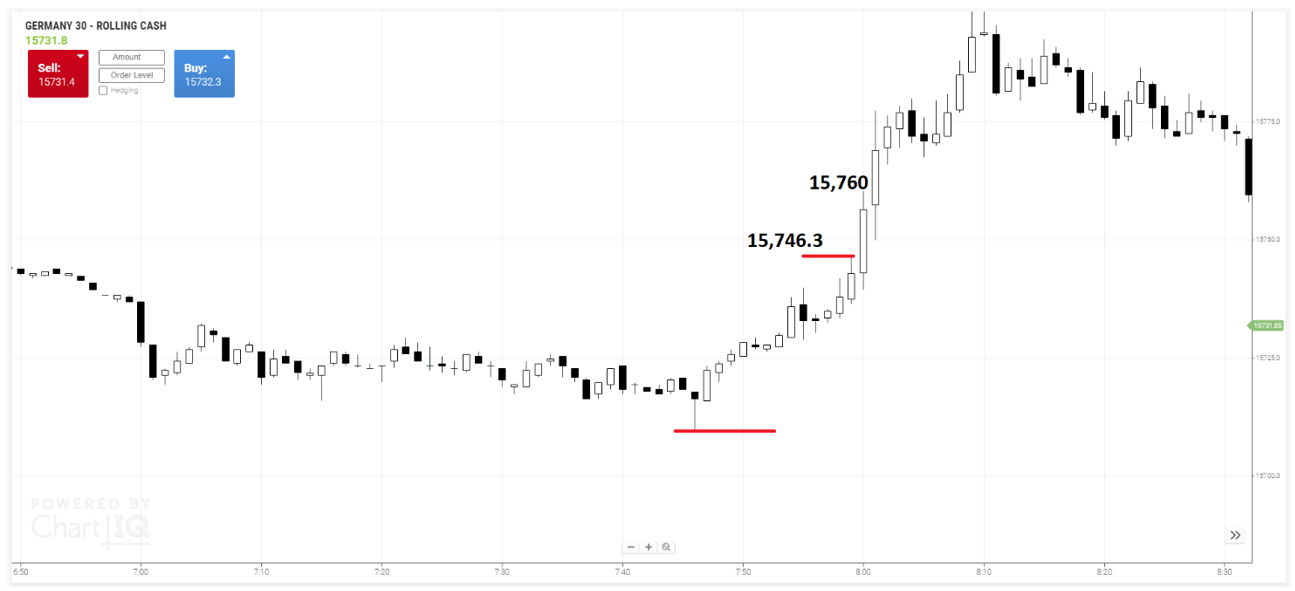
9th August 2021
Here is this morning’s entry. I am editing this document, and I thought I would bring one more day into the documentation. I bring it your attention because there is lesson to be learned here. Right up until the final moment of the 59 minutes observation period, the DAX kept making new highs.
So, inputting an order was tricky for a long position. Why? Because TD365.com wants a minimum distance of 2 points between the entry order price and the current level of the market. Here I simply bought the market at 8am with a 9 point stop loss. I got 6 points within seconds.
This concludes the DAX data. Lets move on to the Dow data.
Breakout of Dow Open
I believe the Dow is a different beast to the Dax. Yes, you can use the same parameters of 9-point stop and 6-point profit target, but as you go through the documentation, you will see how much more potential there is in the Dow index.
Let me put the rules into an easy-to-read format:
- Observe Dow pre-market from 13:30 until 14:29.
- Mark the high and the low of those 59 minutes of trading.
- Place a BUY order at the high of the 59 minutes observation period.
- Place a SELL SHORT order at the low of the 59 minutes observation period.
- This obviously needs to be done in the minute before the market opens. You need to be quick.
- You risk 9 points.
- Your target is to make 6 points, but I always go for more. See documentation and decide for yourself.
- If one order is filled, the other is cancelled.
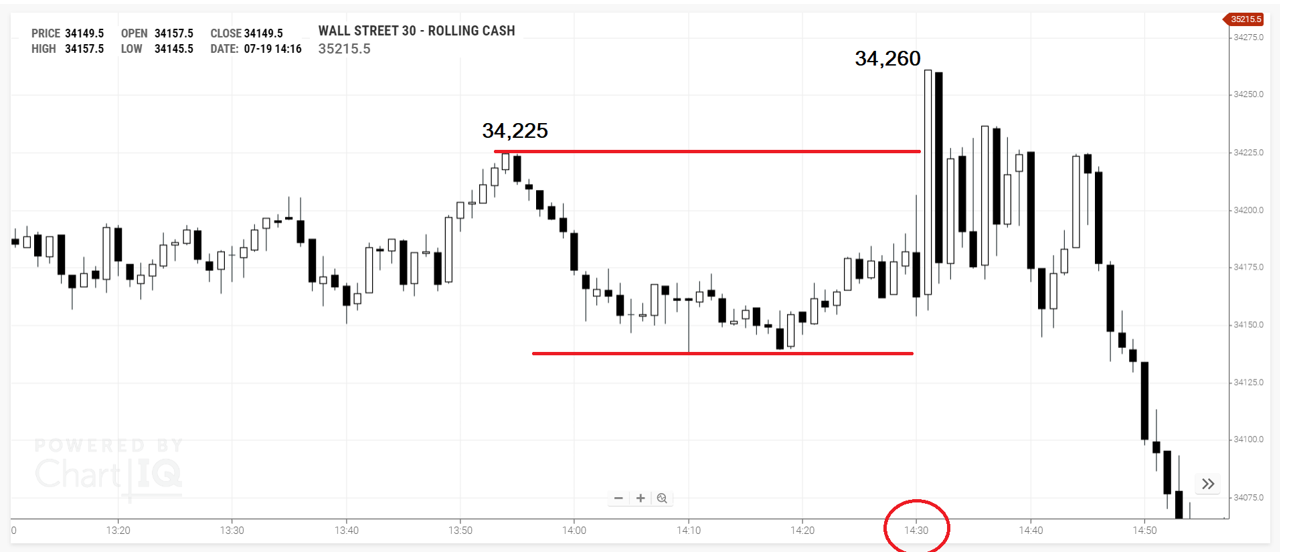
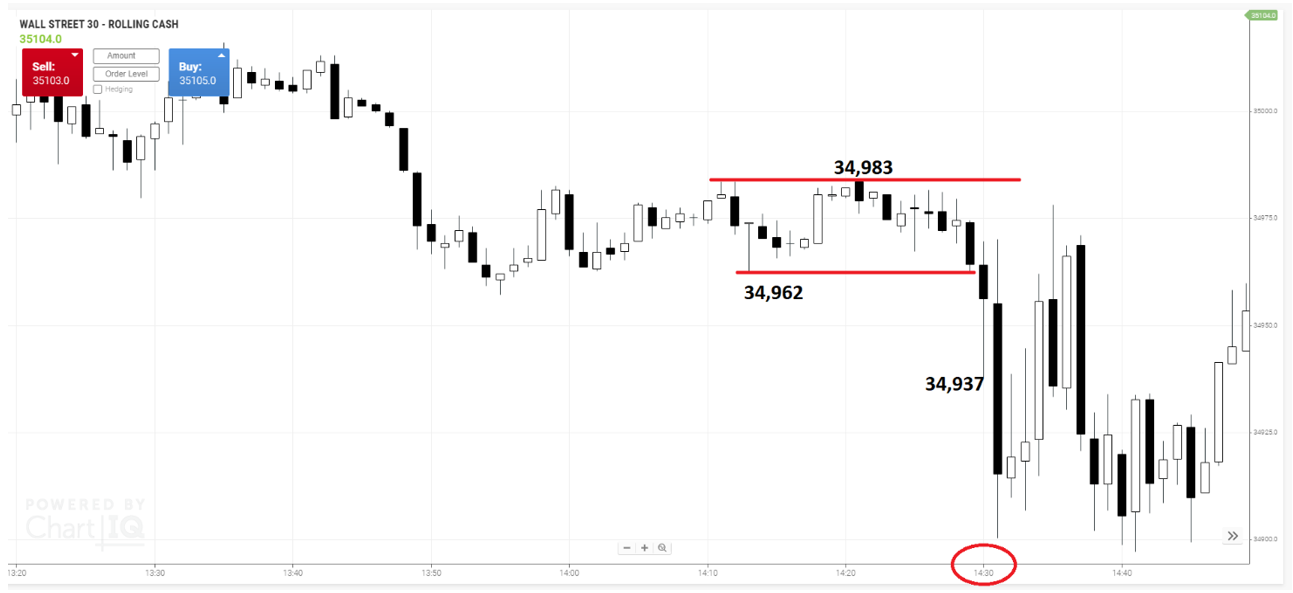
19th July 2021
The Dow high and low in the hour before the open at 14:30 (circled) is marked by the red line. The open at 14:30 GMT (09:30 New York time) marches straight up to comfortably give you 9 points. Truth is there is 35 points to be made in total – minus slippage and spread.
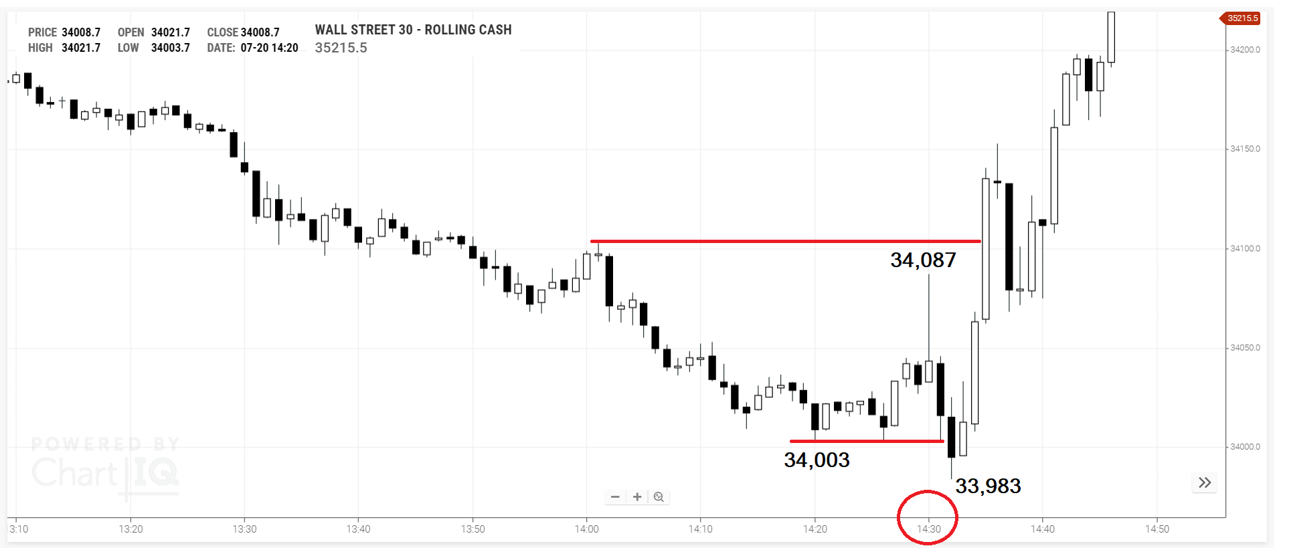
20th July 2021
The Dow high and low in the hour before the open at 14:30 (circled) is marked by the red line. The low is 34,003. The Dow sinks through the level to 33,983.
6 points made.
However, you will notice the 14:31 bar comes close to triggering the short order. If it had, you most certainly would have been stopped out for minus 9.
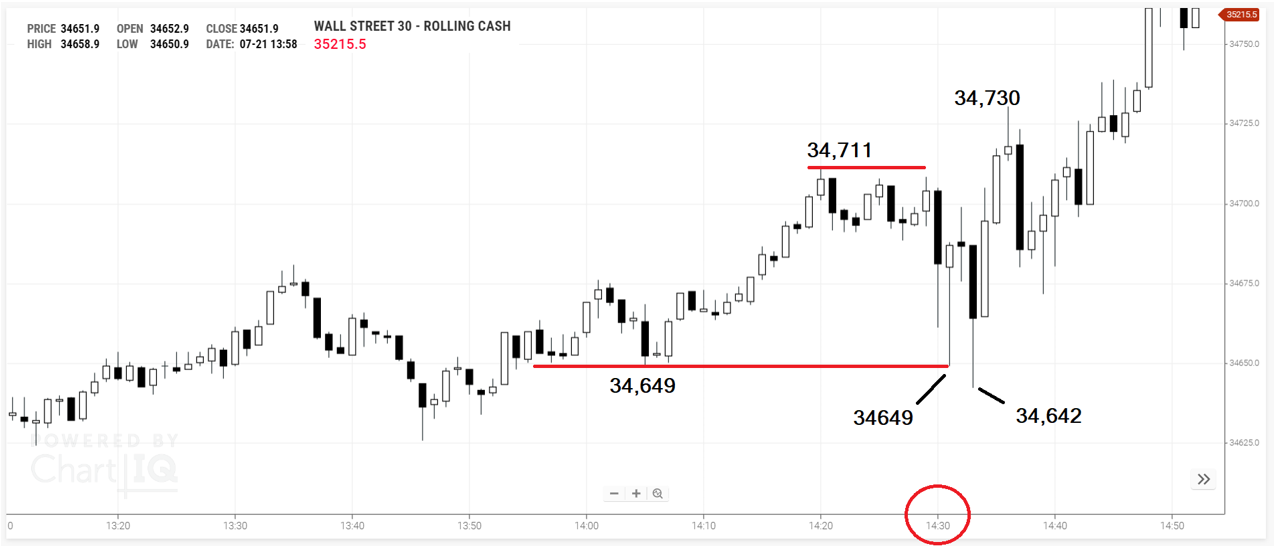
21st July 2021
The short order at 34,649 is triggered, and then you are stopped out really quickly.
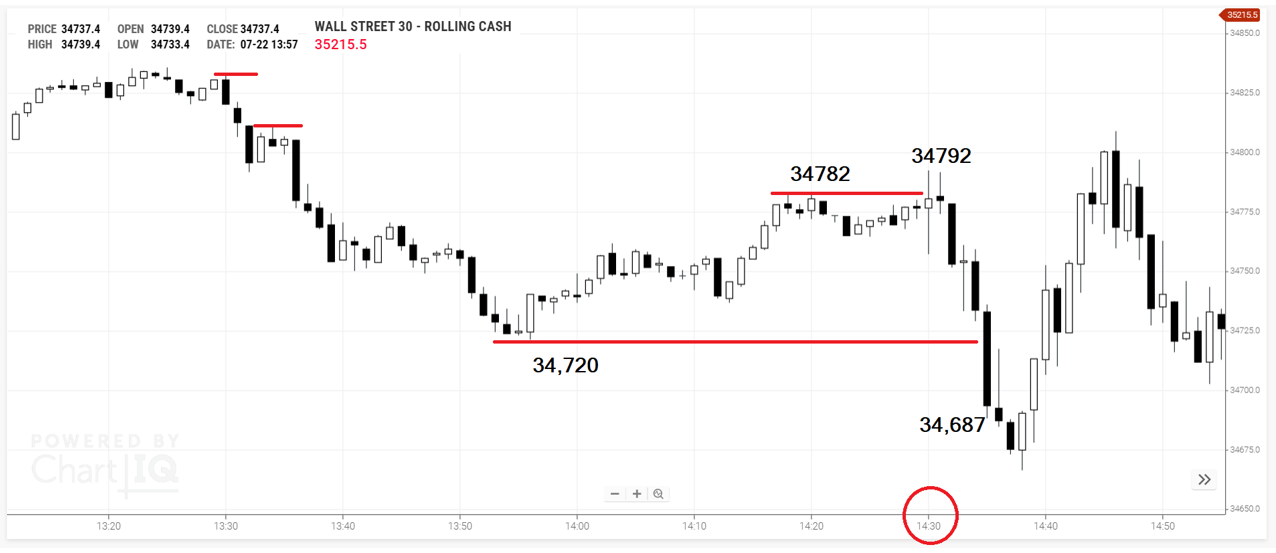
22nd July 2021
This is a close call. You would have made the 6 points, but only just. The downside provided a good short, had it been triggered.
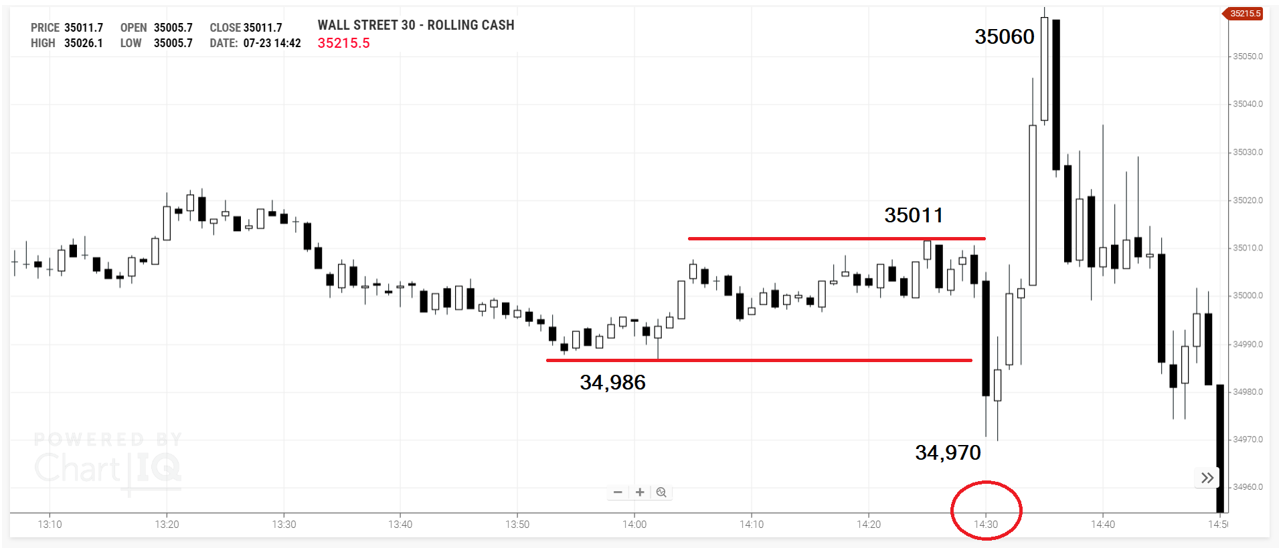
23rd July 2021
6 points made.
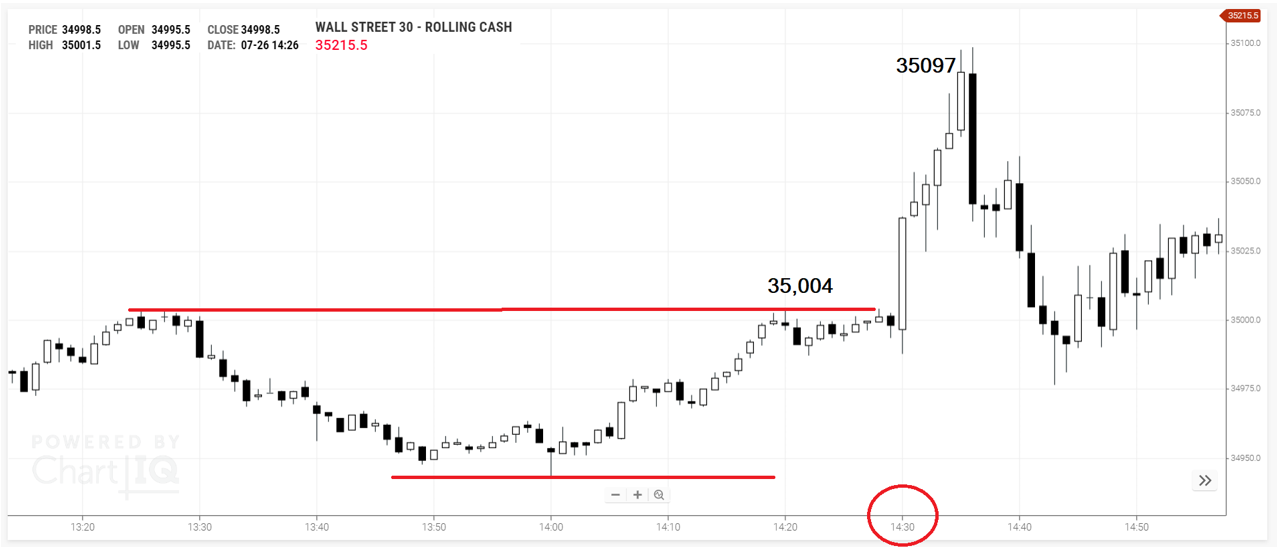
26th July 2021
I think this chart is worth a few more words. It is perhaps more appropriate to form my comment as a question. How would you feel about making 6 points, and then seeing the many more points made over the next 6 minutes? That is the drawback of a system like this.
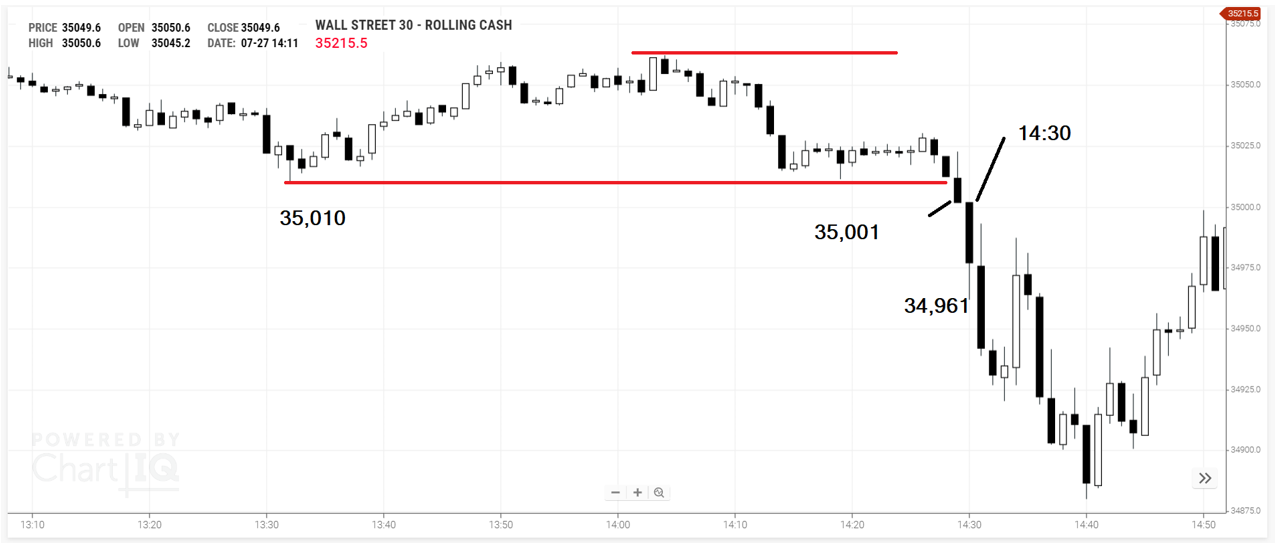
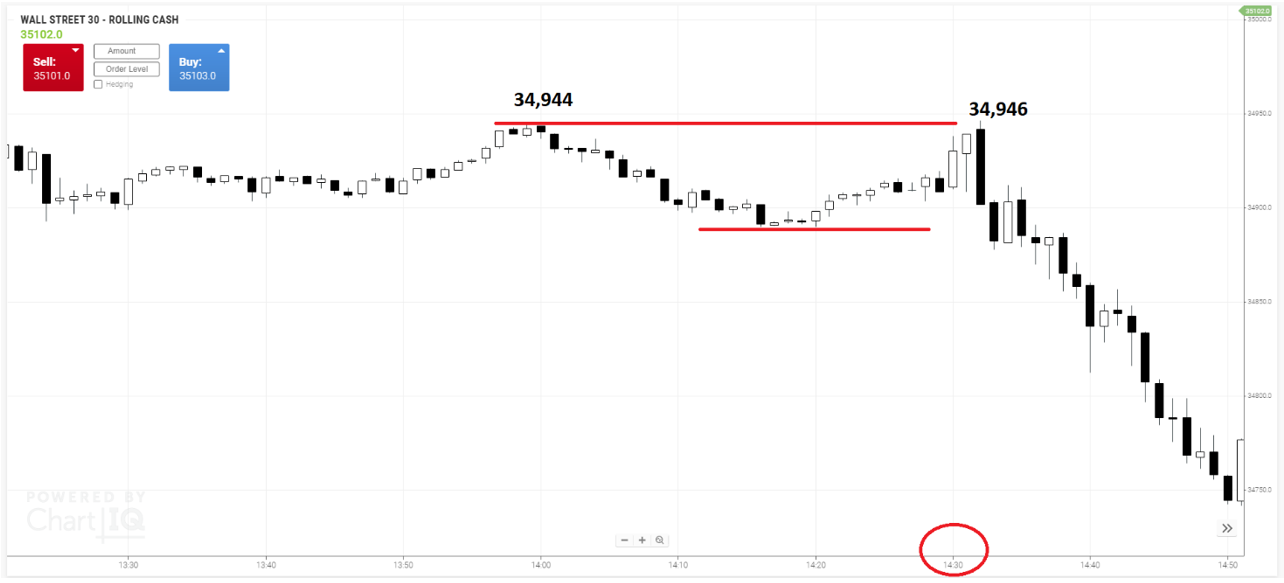
27th July 2021
6 points quickly made. The Dow is actually at its lowest just the moment the 14:30 comes along. This situation was discussed in the DAX under the 9th August example.
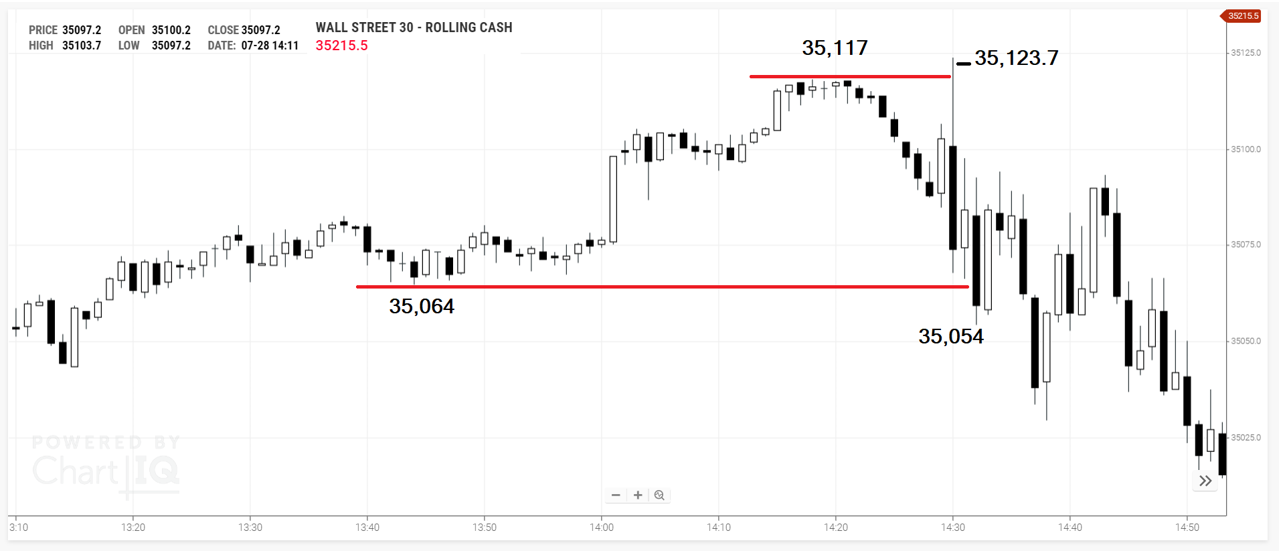
28th July 2021
Almost certainly a loss of 9 points (plus slippage – if any)!!!
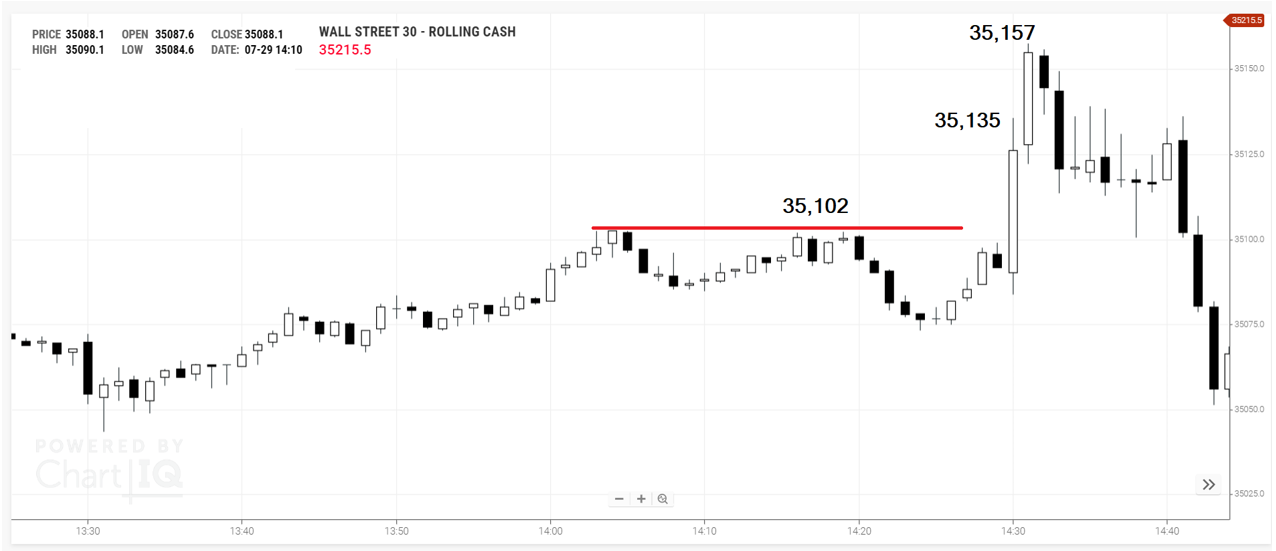
29th July 2021
6 points made.
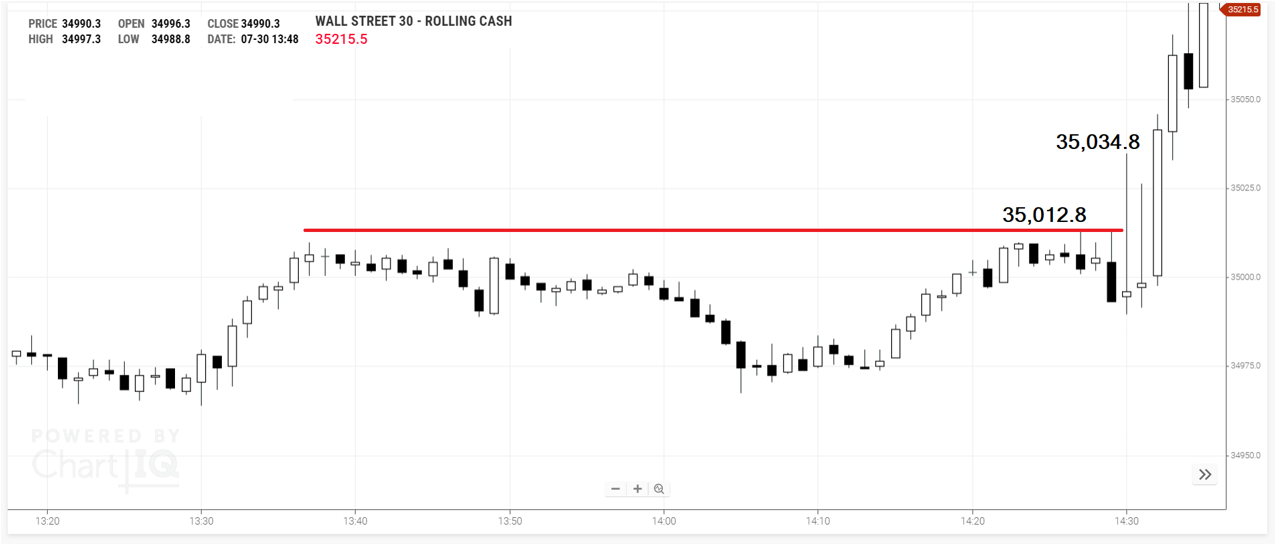
30th July 2021
The Dow high and low in the hour before the open at 14:30 (circled) is marked by the red line. The low is 34,003. The Dow sinks through the level to 33,983.
6 points made.
However, you will notice the 14:31 bar comes close to triggering the short order. If it had, you most certainly would have been stopped out for minus 9.
2nd August 2021
6 points made.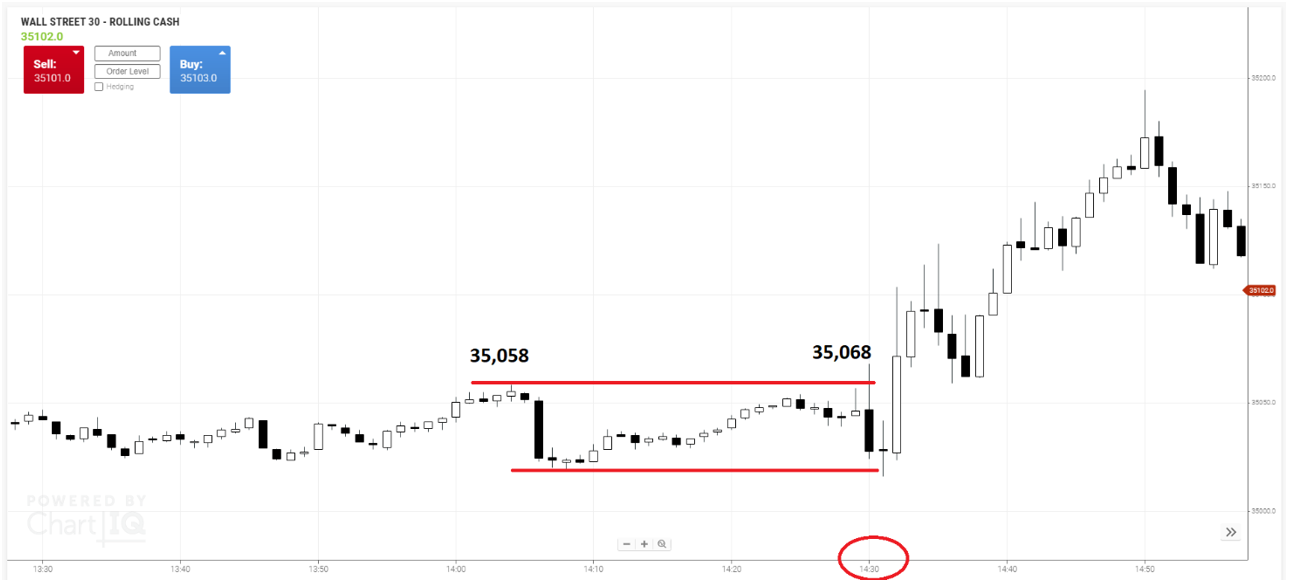
3rd August 2021
9 points lost. Do you see how the Dow just goes above the high set during the 59 minutes and then turns around.
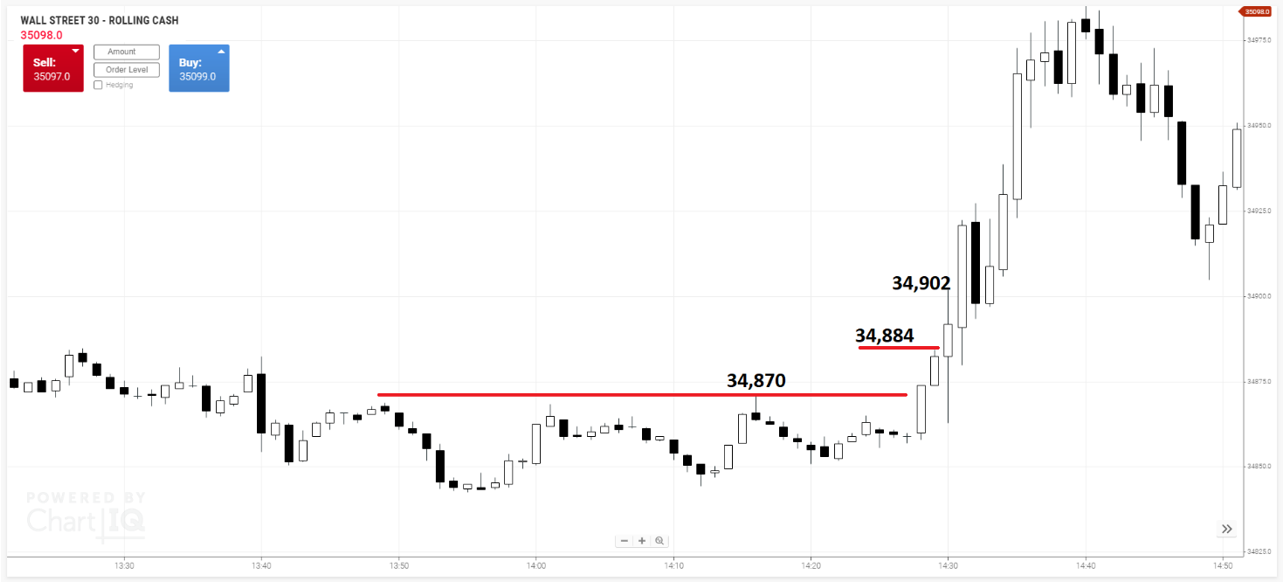
4th August 2021
6 points made.
5th August 2021
I didn’t trade it, and I genuinely don’t know what the outcome would have been. Sorry! The chart is not telling me the outcome either.
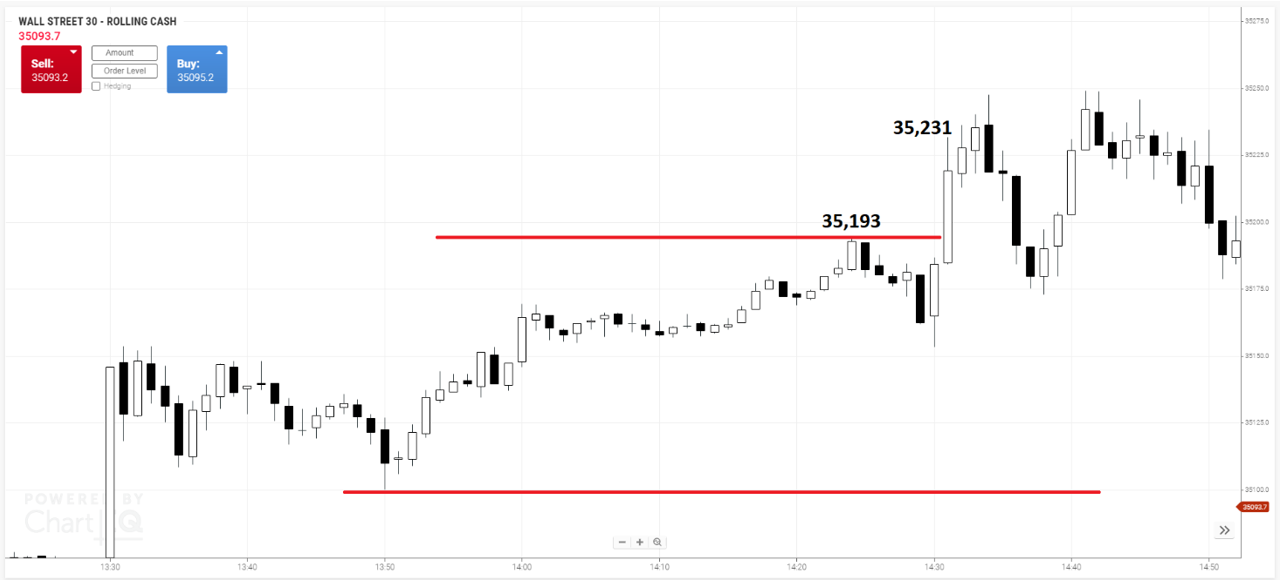
6th August 2021
Plus 6 points made easily. There was a total of 38 on the table, minus slippage and spread.
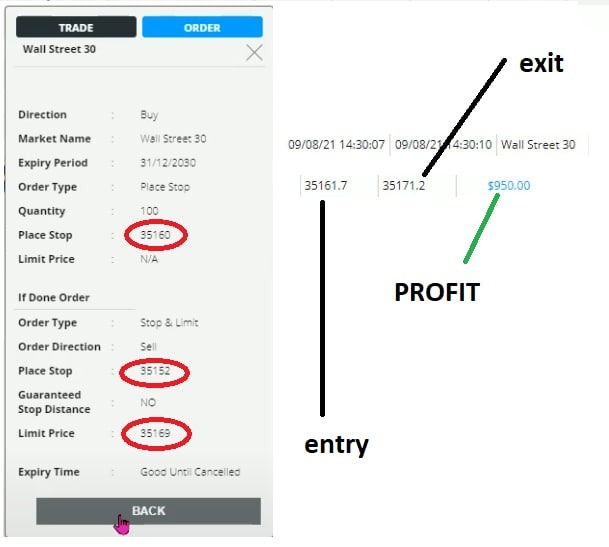
9th August 2021
I filmed myself trading the breakout strategy today. I drew some interesting conclusions today. I input an order to buy Dow at 35,160. However, because the market moved fast, I got filled at 35,161.7.
The slippage was 1.7 point. In a fast market that is to be expected. The open will always be fast. I asked to be filled at 35,160. I was filled at 35,161.7.
The profit target was 10 points. Normally I use a higher target. My research tells me this. I will let you decide for yourself how to play this. Maybe you want to go for 11, maybe 9, maybe 15. Whatever you decide to do, remember that the wider the profit target, the bigger the profit, but the smaller the odds of success.
Today I used 10 because I wanted to be relatively certain that if I got filled, I would also get a profit from it. My limit exit price was 35169. In reality I got filled at 35171.2. It means the positive slippage was 2.1
The trade, as you can see, lasted just 3 seconds.
Good luck.
Tom Hougaard